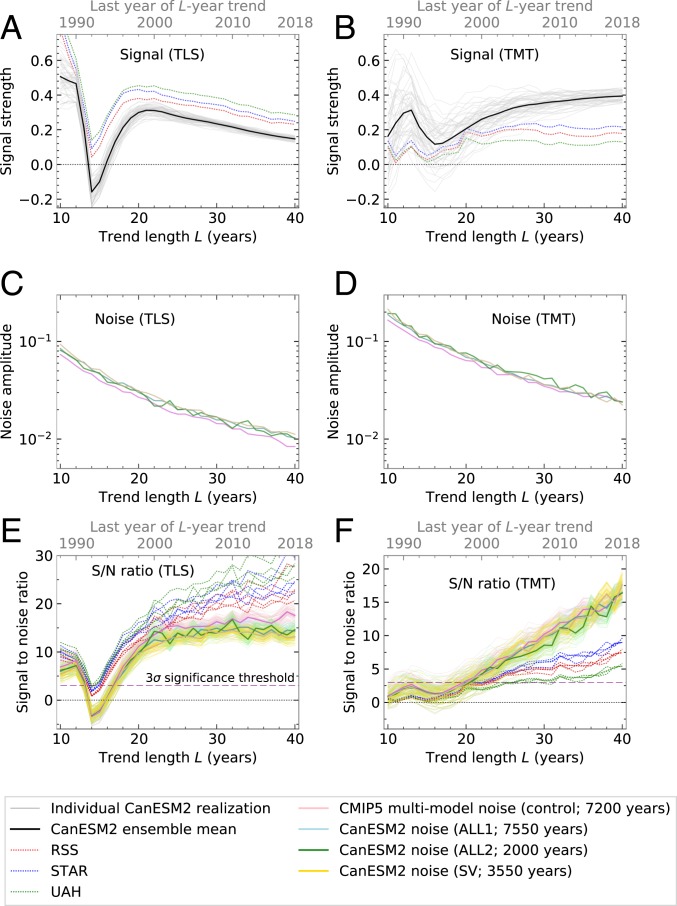
Fig. 4.
Signal, noise, and S/N ratios from a pattern-based fingerprint analysis of annual-mean atmospheric temperature changes in the CanESM2 ALL ensemble and in satellite data. Results are for TLS (A, C, and E) and TMT (B, D, and F) and are a function of the trend length . The domain is near global (N to S for TLS and TMT). For definition of signal trends (A and B) and the standard deviation of the sampling distribution of noise trends (C and D), refer to Materials and Methods.

