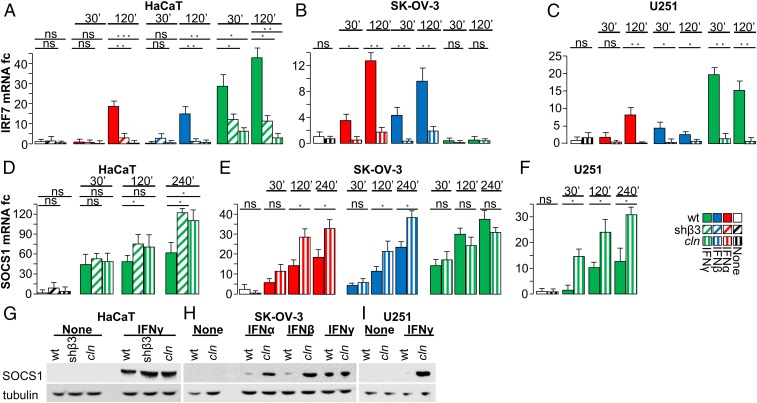
Fig. 2.
IFN-regulated genes. (A–C) Effect of β3-int block on IRF7. The indicated WT, shβ3, or cln-treated cells were exposed to IFNα, IFNβ, or IFNγ for 30 or 120 min, as detailed in Fig. 1. IRF7 mRNA was determined by qRT-PCR. (D–I) Effect of β3-int block on SOCS1. Cells were treated as in A–C. (D–F) SOCS1 mRNA. (G–I) WB analysis of SOCS1 and tubulin in the indicated cells. In A–F, histograms represent the average of triplicates ±SD. G–I are representative images of triplicate experiments. Statistical significance was calculated by means of the t test (B, C, E, and F) or 1-way ANOVA (A and D). *P < 0.05, **P < 0.01, ***P < 0.001; ns, nonsignificant.

