Fig. 5.
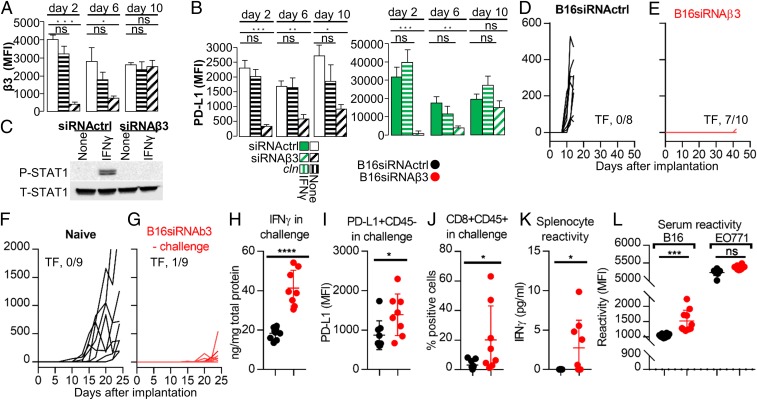
B16 murine cancer cells transiently depleted of β3-int exhibit a reduction in PD-L1 expression in vitro and in the growth of primary and challenge tumors, and the challenge tumors show signs of immunotherapeutic effects. Long-term reactivity of splenocytes and serum. (A–C) Effect of transient β3-int depletion on PD-L1 and P-STAT1. B16 cells were transiently depleted of β3-int by siRNAβ3 (B16siRNAβ3), or mock-depleted by scrambled siRNA (B16siRNActrl), by siRNA transfection. (A) β3-int silencing (MFI) at day 2, 6, and 10 after siRNA transfection. (B) PD-L1 MFI in β3-int–depleted cells, unexposed (no IFN) or exposed to IFNγ (100 IU) for 24 h, and measured at day 2, 6, and 10. (C) P-STAT1 and T-STAT1 6 d after siRNA transfection. Details are as in the legend to Fig. 1. (D–L) C57BL/6 mice were implanted with B16siRNActrl (black) or B16siRNAβ3 (red) cells. (D and E) Growth kinetics of the primary tumor. (F and G) Mice previously implanted with B16siRNAβ3 cells (red) (G), at day 18 after primary tumor implantation, or naïve mice (black) (F) received a challenge tumor made of B16siRNActrl cells. Kinetics of the challenge tumor growth. (H–L) Characterization of the challenge tumor in the siRNAβ3 arm (red) or siRNActrl arm (black). (H) IFNγ content of tumors. (I) PD-L1 in CD45− tumor cells. (J) CD8+/CD45+ cells. (K) Splenocyte reactivity to B16 cells, quantified as IFNγ release. (L) Serum reactivity to B16 and unrelated EO771 cells. In A and B, histograms represent the average of triplicates ±SD. In C are representative images of repeated triplicate experiments. D and E represent data of B16siRNActrl (8 mice) or B16siRNAβ3 (10 mice) arms. F–L represent data of naïve (B16siRNActrl, 9 mice) or B16siRNAβ3 challenge (9 mice in K and L; 8 tumors in G–J). Statistical significance was calculated by t test (H–L) or 1-way ANOVA (A and B). *P < 0.05, **P < 0.01, ***P < 0.001, ****P < 0.0001; ns, nonsignificant.

