Fig. 3.
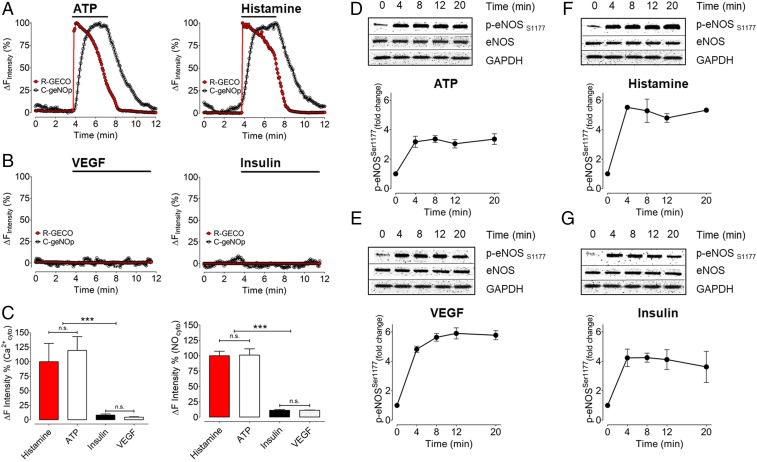
Correlating multispectral imaging for NO and Ca2+ with eNOS phosphorylation. (A) Representative time course of intracellular Ca2+ (red curve) and NO (black curve) of a single EA.hy.926 cell in response to 30 µM ATP (Left) and 10 µM histamine (Right). (B) Curves show VEGF (10 ng/mL, Left) and insulin (100 nM, Right) induced Ca2+ (red curve) and NO (black curve) signals. (C) Bars in Left represent relative quantification of R-GECO signals in response to histamine (red bar, n = 3/7), ATP (white bar, n = 3/8), insulin (black bar, n = 3/17), and VEGF (white dotted bar, n = 3/14). Bars in Right represent the maximal amplitude of C-geNOp signals in response to histamine (red bar, n = 3/13), ATP (white bar, n = 3/11), insulin (black bar, n = 3/9), and VEGF (white dotted bar, n = 3/17). Absolute quantification for geNOp responses between histamine and ATP yielded 8.87 ± 2.32% and 8.96 ± 2.98% for histamine and ATP, respectively. *P < 0.05 compared with other groups using ANOVA and Tukey’s multiple comparison test. (D–G) Representative immunoblots from time course experiments analyzed in cells treated with ATP, histamine, VEGF, and insulin for times as indicated. Immunoblots of cell lysates were probed with antibodies directed against phospho-eNOS Ser1177. Equal loading was confirmed by immunoblotting with an antibody against total eNOS. The pooled data from 3 independent experiments represent the intensities corresponding to phospho-eNOS at Ser1177 by chemiluminescence. Values are presented as mean ± SD, ***P < 0.001 versus control using ANOVA and Tukey’s multiple comparison test.

