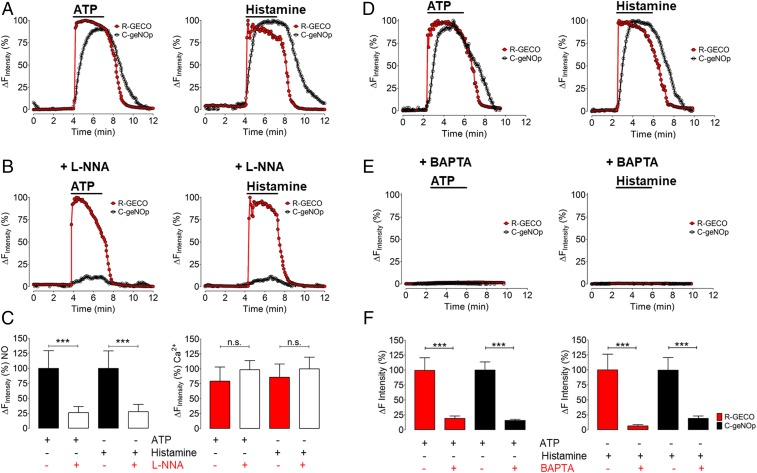
Fig. 4.
Pharmacological inhibition of intracellular Ca2+ release and NO formation. (A) Representative time course of Eahy.926 cells coexpressing R-GECO1 and C-geNOp. Red curves represent cytosolic Ca2+, and black curves represent NO signals in response to 30 µM ATP (Left) and 10 µM histamine (Right). (B) Graphs show the same experimental conditions, as shown in A. Cells were pretreated with 300 µM l-NNA for 30 min before the imaging experiment. (C) Bars of the Left represent maximal amplitude of C-geNOp signals in the absence of l-NNA and presence of ATP (black bar, n = 3/11), in the presence of ATP and l-NNA (white bar, n = 3/12), in response to histamine (white dotted bar, n = 3/11), and in the presence of histamine and l-NNA (gray dotted bar, n = 3/14). Bars in Right represent maximal amplitude of R-GECO1 signals in response to ATP (red bar, n = 3/16), in response to ATP and the presence of l-NNA (white bar, n = 3/18), in response to histamine (red dotted bar, n = 3/16), and in response to histamine in the presence of l-NNA (white dotted bar, n = 3/18). (D) Representative control experiments of intracellular Ca2+ (red curve) and NO (black curve) of a single EA.hy926 cell in response to 30 µM ATP (Left) and 10 µM histamine (Right). (E) Graphs show the same experimental conditions as in D. Cells were pretreated with 20 µM BAPTA for 45 min before the imaging experiment. (F) Bars in Left represent the maximal amplitude of R-GECO signals in the absence of BAPTA and presence of ATP (red bar, n = 3/13), in the presence of ATP and BAPTA (Right red bar, n = 3/7). Black bars in Left represent maximal C-geNOp signals in the presence of ATP (Left black bar, n = 3/10), and the presence of ATP and BAPTA (Right black bar, n = 3/14). Bars of Right represent the maximal amplitude of R-GECO signals in the absence of BAPTA and presence of histamine (red bar, n = 3/13), in the presence of histamine and BAPTA (Right red bar, n = 3/11). Black bars in Right represent maximal C-geNOp signals in the presence of histamine (Left black bar, n = 3/13), and the presence of histamine and BAPTA (Right black bar, n = 3/7). ***P < 0.05 compared with other groups using ANOVA and Tukey’s multiple comparison test.

