Fig. 5.
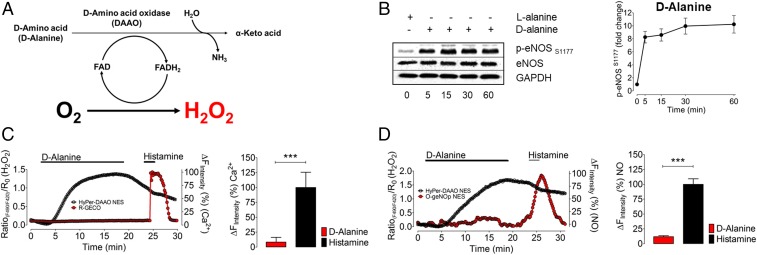
Chemogenetic H2O2 production and multispectral imaging of H2O2, Ca2+, and NO. (A) The schematic shows the DAAO catalytic pathway that oxidizes d-amino acids into keto acids and produces equimolar H2O2. (B) Representative immunoblots show time course experiments in EA.hy926 endothelial cells expressing DAAO-HyPer and incubated with 10 mM d-alanine (Left). Right presents pooled data from quantitative analysis of immunoblots probed with antibodies against phospho-eNOS1177. Values are presented as mean ± SD, ***P < 0.001 versus control using ANOVA and Tukey’s multiple comparison test. (C, Left) Representative time courses of a coimaging experiment of an Eahy.926 cell coexpressing R-GECO (red curve) and HyPer-DAAO (black curve). Cells were perfused with 10 mM d-alanine and 10 µM histamine for the indicated durations. (Right) Respective statistics for the maximum R-GECO response when treated with 10 mM d-alanine (red bar, n = 3/8) or 10 µM histamine (black bar, n = 3/8). (D, Left) The representative time course of a coimaging experiment of an EA.hy926 cell coexpressing O-geNOp (red curve) and HyPer-DAAO (black curve). Cells were perfused with 10 mM d-alanine and 10 µM histamine for the indicated times. (Right) Respective statistics for the maximum O-geNOp response when treated with 10 mM d-alanine (red bar, n = 3/18) or 10 µM histamine (black bar, n = 3/18). ***P < 0.05 versus control using the unpaired t test.

