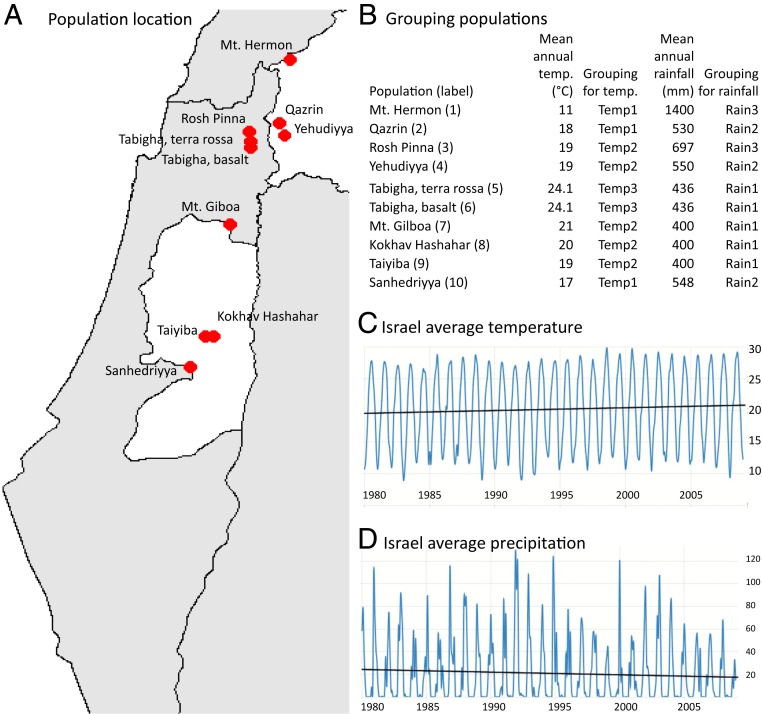
Fig. 1.
Sampling location, population grouping, temperature, and precipitation in Israel. A shows the locations of the 10 WEW populations studied; B displays the population grouping for climate-specific groups based on mean annual rainfall and temperature in each location; C illustrates the changes in Israel from 1980 to 2008 of average temperature from below 20 °C to above 20 °C; and D shows the changes in Israel from 1980 to 2008 of average precipitation from above 20 mm to below 20 mm. Note that the weather data were acquired from the World Bank website Tradingeconomics.com.

