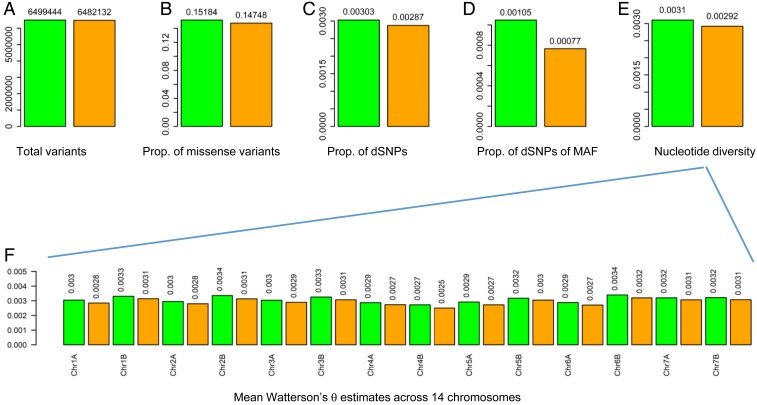
Fig. 2.
SNP detection, SNP characterization, and nucleotide diversity in the samples of WEW collected in 1980 and in 2008. A shows the total variants detected for each sample group; B the proportion of the missense variants detected over the total SNPs; C the proportion of the dSNPs; D the proportion of dSNPs with minor allelic frequencies (MAF) smaller than 0.05; E mean Watterson’s θ estimates; and F mean Watterson’s θ estimates across 14 chromosomes. In each graph, the 1980 and 2008 samples are labeled in green and orange, respectively, and the sample mean values are shown above the bars.

