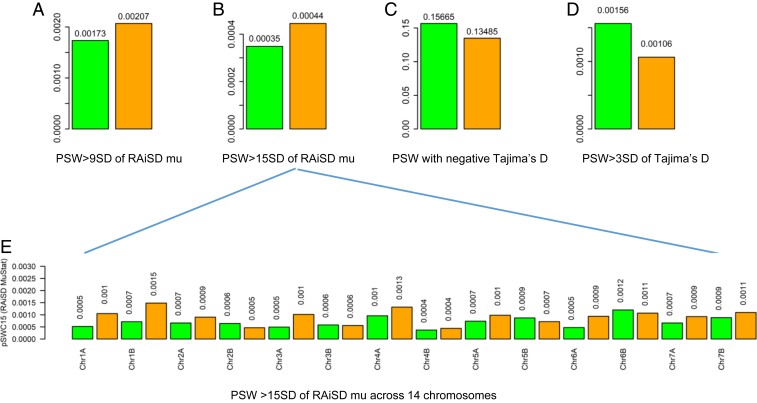
Fig. 3.
Selection signals detected by RAiSD and Tajima’s D in the samples of WEW collected in 1980 and in 2008. A shows the proportion of sliding windows (PSW) with RAiSD MuStat estimates greater than 9 SDs; B the proportion of sliding windows with RAiSD MuStat estimates greater than 15 SDs; C the proportion of sliding windows with negative Tajima’s D estimates; D the proportion of sliding windows with positive Tajima’s D estimates greater than 3 SDs; and E the proportion of sliding windows with RAiSD MuStat estimates greater than 15 SDs across 14 chromosomes. In each graph, the 1980 and 2008 samples are labeled in green and orange, respectively, and the sample mean values are shown above the bars.

