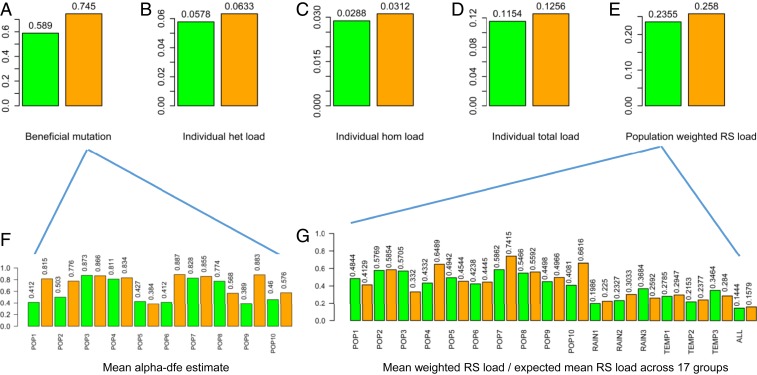
Fig. 4.
Estimates of adaptive mutations and mutational burdens in the samples of WEW collected in 1980 and in 2008. A–E show the estimates of adaptive mutations, mean individual heterozygous (het), homozygous (hom) and total mutational burden, and the population weighted GERP++ RS mutational burdens. F and G display the mean alpha-dfe estimate for each population and the ratios of mean weighted RS load vs. expected mean RS load across 17 sample groups. In each graph, the 1980 and 2008 samples are labeled in green and orange, respectively, and the sample mean values are shown above the bars.

