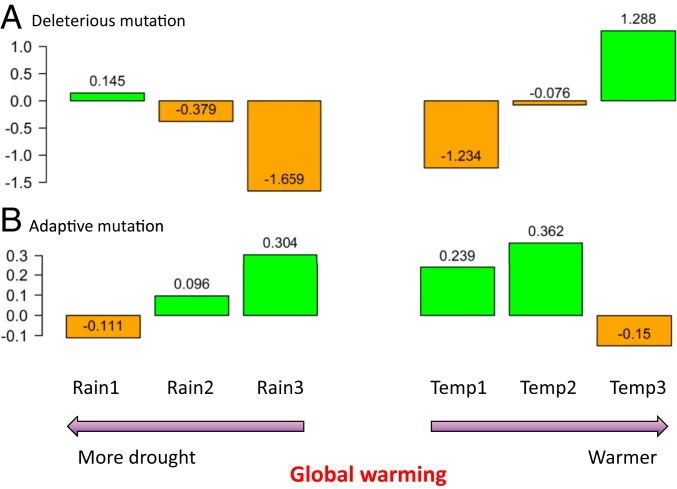
Fig. 5.
Changes in the estimates of deleterious base-substitution mutations per sample (×10−8; A) and adaptive mutations (B) in 6 climate-specific groups in response to 28 y of global warming. Positive and negative changes are highlighted in green and orange, respectively, and the differences are shown above or within the bars.

