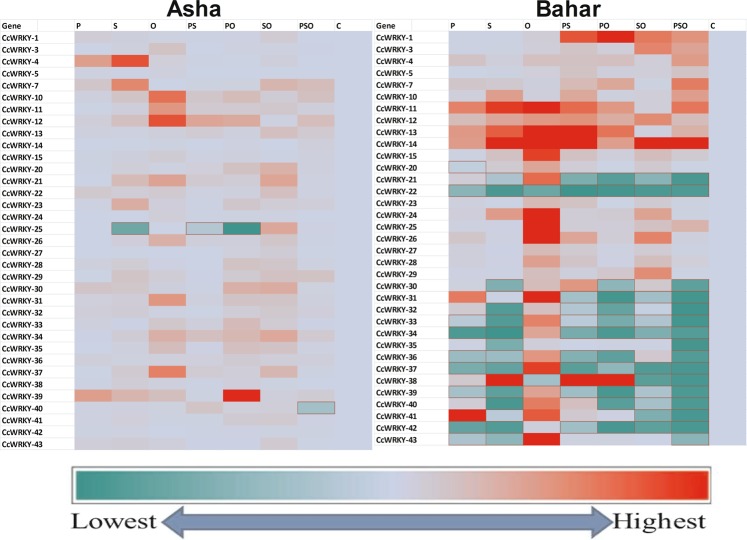
Figure 2.
Heat maps of expression profiles of 35 selected CcWRKY genes in the pigeonpea cultivars Asha and Bahar in different treatments: P (Pathogen Fusarium udum), S (Salt-NaCl), O (Pseudomonas fluorescens OKC), PS (Pathogen + Salt), PO (Pathogen + Pseudomonas), SO (Salt + Pseudomonas), PSO (Pathogen + Salt + Pseudomonas) and C (Control). The colour scale indicates the expression value (dark red indicate higher expression value, darker green indicates lower gene expression values).

