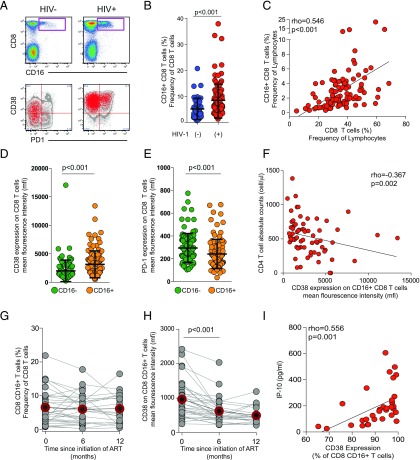
FIGURE 1.
FcγRIIIA+ CD8 T cells expand numerically and persist in Ugandans with untreated HIV-1 infection. (A) Bivariate pseudocolor flow cytometry plots of FcγRIIIA+ CD8 T cells after gating on small lymphocytes that are Aqua LIVE/DEAD−TCR a/b+, CD8+CD3+ T cells in healthy donors (HIV−) (n = 40) and HIV-1–infected (HIV+) individuals (n = 103). Overlay plots of FcγRIIIA+ CD8 T cells (in red) and bulk CD8 T cells in gray for representative HIV− and HIV+ donors. (B) Scatter plot of the frequency of FcγRIIIA+ CD8 T cells in HIV+ versus HIV− healthy donors with lines at the mean and SD shown. (C) Correlation of the FcγRIIIA+ CD8 T cell subset frequency with the overall CD8 compartment frequency. (D) CD38 MFI and (E) PD-1 MFI in FcγRIIIA+ CD8 T cells (orange) as compared with the overall CD8 compartment (green) with lines at the mean and SD. (F) Correlation between FcγRIIIA+ CD8 T cells and absolute CD4 T cell counts. Longitudinal graph of the FcγRIIIA+ CD8 T cell subset frequency (G) and the CD38 MFI of FcγRIIIA+ CD8 T cell subset (H) in patients starting ART (n = 32) at baseline, 6, and 12 mo after ART initiation. Gray circles and lines represent individuals and red line and outlined, filled circle represents the median level. (I) Correlation between activation levels in FcγRIIIA+ CD8 T cells and TNFRII levels in plasma.

