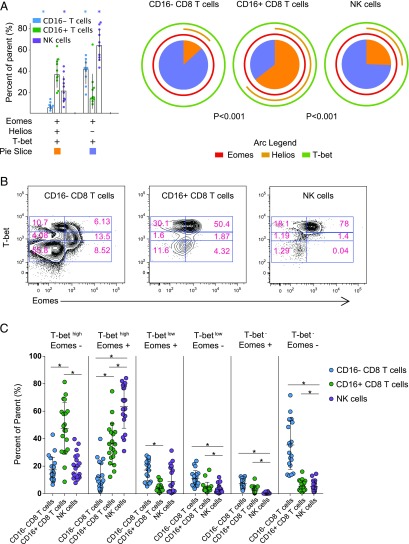
FIGURE 3.
Transcription factors T-bet, Eomes, and Helios expression in CD8 T cells with or without FcγRIIIA and NK cells. In HIV+ (n = 10) and HIV− (n = 10) individuals (A) expression of T-bet, Eomes, and Helios, assessed by intracellular staining, is presented for CD8 T cell subsets having or lacking FcγRIIIA (CD16) surface expression in comparison with NK cells. FcγRIIIA− CD8 T cells (blue), FcγRIIIA+ CD8 T cells (green), and NK cells (purple) are displayed on a bar graph with individual points shown. Asterisks denote statistically significant differences of the FcγRIIIA+ CD8 T cells, with a p value <0.05). Major populations expressing all three transcription factors (orange box) and positive for T-bet and Eomes in the absence of Helios (lavender) are presented and correspond to slices of the pie chart. Individual expression of each transcription factor is shown by an arc (Eomes in red, Helios in gold, and T-bet in light green). A p value is presented for comparison of distribution of each part of the pie between groups. (B) Example flow cytometry plots showing the coordinated expression of T-bet and Eomes for FcγRIIIA− CD8 T cells, FcγRIIIA+ CD8 T cells, and NK cells. (C) Scatter plot for FcγRIIIA− CD8 T cells (blue), FcγRIIIA+ CD8 T cells (green), and NK cells (purple) for subsets of cells expressing high, medium, or low levels of T-bet and positive or negative for Eomes, with lines at the mean and SD shown. Line with * denotes statistical significance between cell populations. *p < 0.05.

