FIGURE 8.
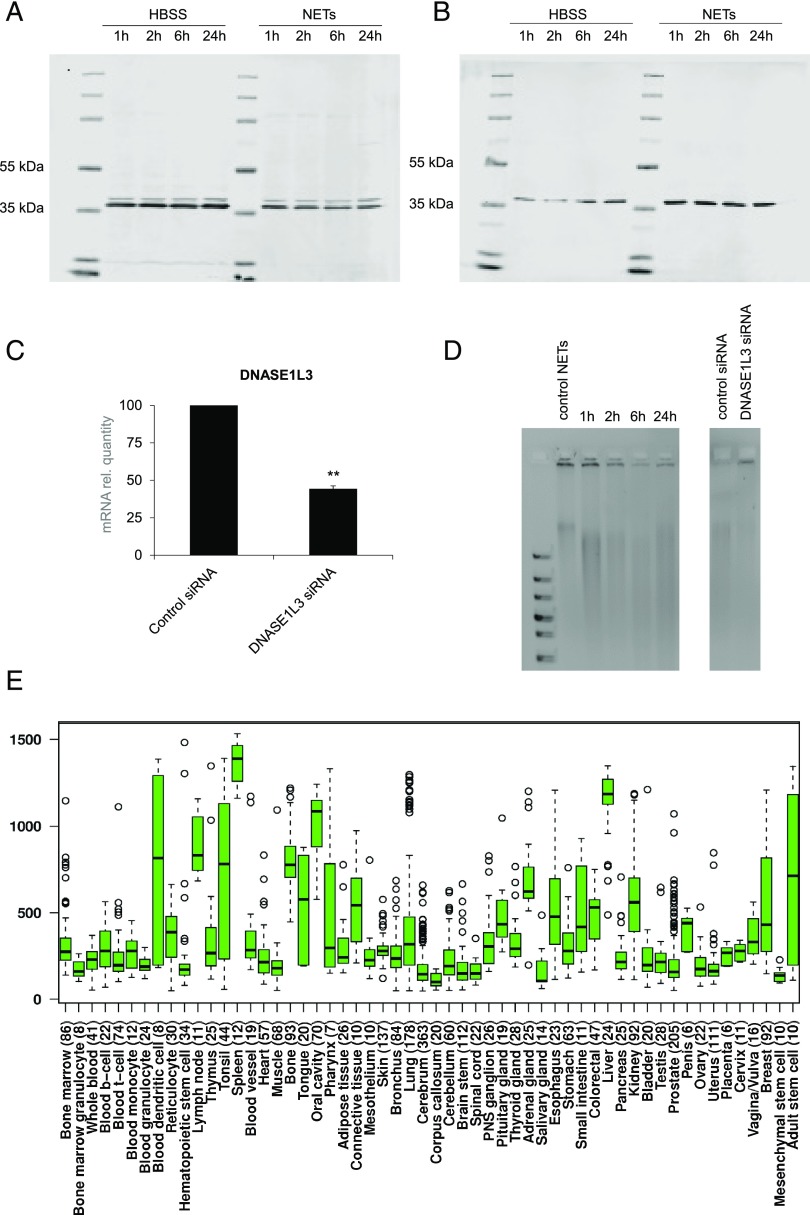
Secreted DNase1L3 degrades NETs extracellularly. Western blots of cell lysates from pellets (A) and supernatants (B) of MDDCs cultured in HBSS or exposed to HBSS containing purified NETs for 1, 2, 6, and 24 h. Membranes were probed with Abs against human DNase1L3 (predicted molecular mass = 36 kDa). Note that two bands were observed in cells and only one band in the supernatants. Equal loading was verified by using a total protein normalization protocol (data not shown). (C) Expression of DNASE1L3 in MDDCs transfected with control siRNA or DNASE1L3 siRNA. Data are expressed as mRNA normalized to GAPDH, and the control siRNA values were arbitrarily set to 100, and normalization was carried out to simplify the comparison. Results shown are mean values ± SEM. **p < 0.01. (D) NET-containing supernatants retrieved from the same experiments as in (B), or supernatants retrieved from MDDCs transfected with either control siRNA or DNASE1L3 siRNA as in (C) containing NETs were run on a 1% agarose gel after promoting DNase1L3 enzymatic activity by addition of 2 mM CaCl2 and 2 mM MgCl2 for 1 h. NETs alone were loaded as a control (left gel). The bands just below the loading wells indicate nondigested NETs. The results shown are representative of three similar experiments using cell supernatants from different donors. (E) Expression of human DNASE1L3 was derived from the IST microarray database (22). Each box represents the quartile distribution (25–75%) range with the median value indicated with a horizontal line. The 95% range including individual outlier samples is also displayed. The y-axis indicates the relative gene expression levels.

