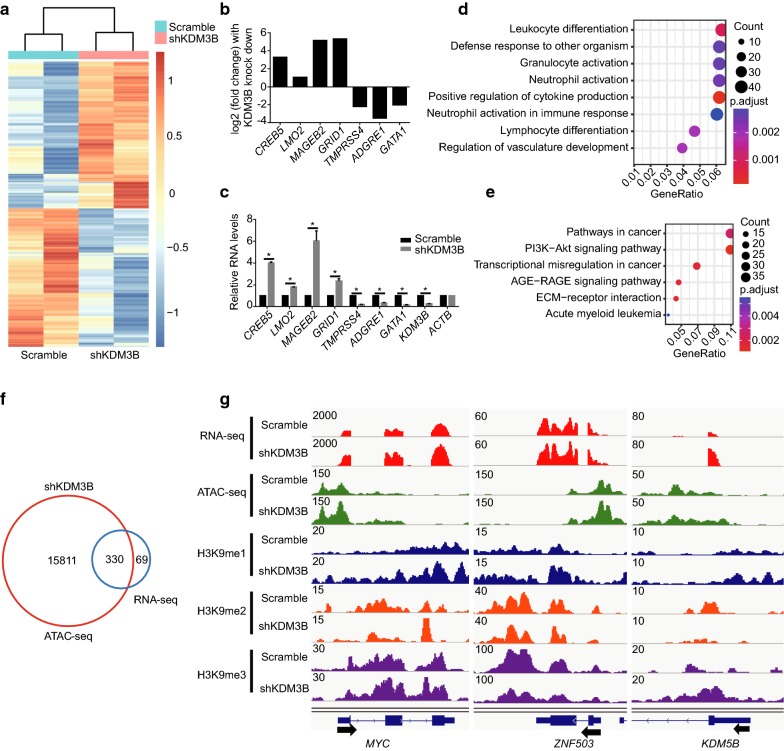
Fig. 3.
Integration of ATAC-seq data with RNA-seq for the activated genes after KDM3B silencing in NB4 cells. a Heatmap of differentially expressed genes (defined as |fold change| ≥ 1.5, with a P-value < 0.05) in KDM3B-knockdown NB4 cells relative to scrambled control cells. b Histogram showing a subset of the genes identified differentially expressed in NB4 cells expressing scrambled control versus shKDM3B from RNA-seq data. c RT-qPCR validation of differentially expressed genes in “B” following silencing of KDM3B in NB4 cells. Relative mRNA levels were calculated by 2−ΔΔCT method and normalized to ACTB (β-actin). d GO analysis performed on the differentially expressed genes. e Pathway analysis using KEGG was performed on the genes differentially expressed. f Venn diagrams indicating the proportion of genes that differentially expressed in NB4 cells expressing scrambled control versus shKDM3B based on RNA-seq data that have ATAC-seq peaks (identified only in KDM3B knock-down NB4 cells). g Genome browser tracks of RNA-seq data; ATAC-seq data; H3K9me1, H3K9me2 and H3K9me3 ChIP-seq data at the MYC, ZNF503 and KDM5B loci following silencing of KDM3B in NB4 cells. Values are derived from three independent experiments, and data were mean ± SD. *P < 0.05

