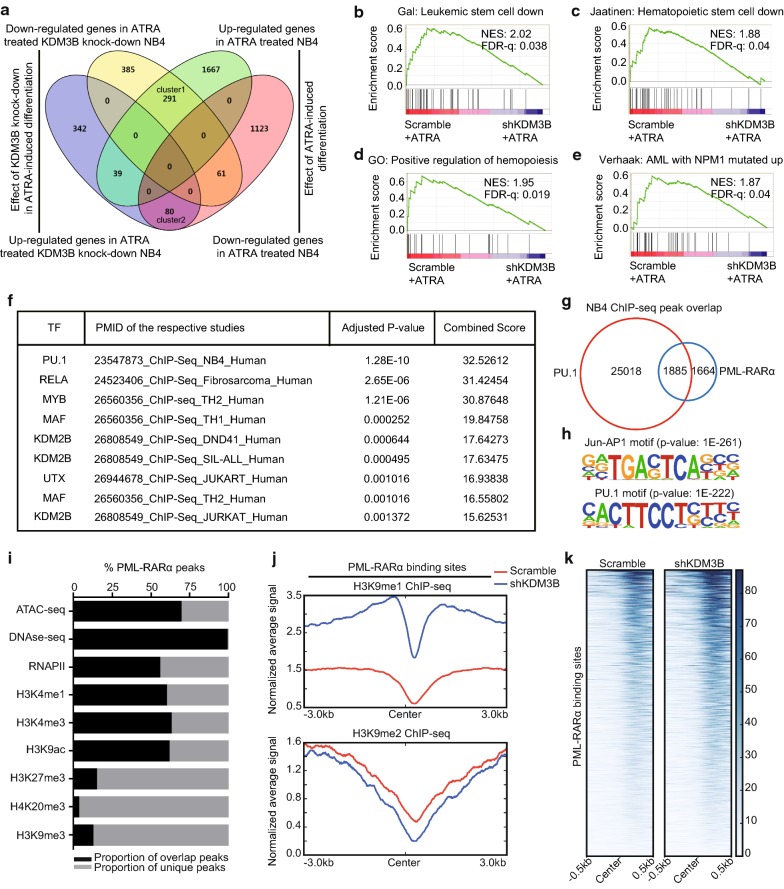
Fig. 4.
KDM3B influences the expression of ATRA-regulated genes in differentiation of NB4 cell. a Venn diagram illustrates the number of genes regulated by ATRA, the genes influenced by KDM3B in ATRA-induced differentiating, and the overlaps of these 2 gene sets. 291 genes are less induced by ATRA in KDM3B-knockdown NB4 cells than normally expected (cluster1), 80 genes are more up-regulated in KDM3B-knockdown NB4 cells as compared with the control (cluster 2). b–e GSEA of the expressing profile of NB4 cells transfected with scramble control or shKDM3B followed by treatment with ATRA using a Leukemic stem cell down-regulated signature (b), a Hematopoietic stem cell down-regulated signature (c), a positive regulation of hemopoiesis-associated signature (d), and a AML with NPM1 mutated-associated signature (e). f ChIP enrichment analysis of differentially expressed genes in KDM3B-knockdown NB4 cells relative to scrambled control cells followed by treatment with ATRA. The top 9 ranked transcription factors are shown (ranked by adjusted P-value). g Overlap of PU.1 and PML/RARα binding revealed by ChIP-seq. The peak numbers of each category are shown on the venn diagram. h De novo motif analysis of PML/RARα binding sites. Significantly enriched motifs are shown. i PML/RARα binding sites overlap with the active and repress histone modification. j Signal intensity plot representing changes in H3K9me1 and H3K9me2 ChIP-seq signal at PML/RARα binding regions followed by silencing of KDM3B in NB4 cells. The enriched regions were extended ± 3 kb from their midpoint. k Chromatin accessibility in NB4 cells expressing scrambled control versus shKDM3B at PML/RARα binding regions. The enriched regions were extended ± 0.5 kb from their midpoint

