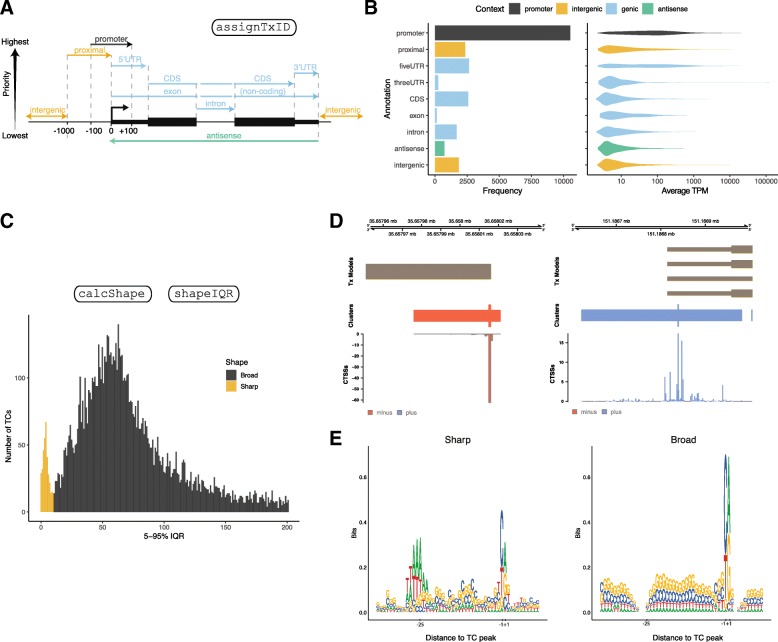
Fig. 2.
Analysis of tag clusters. a: Schematic of the hierarchical annotation scheme used by CAGEfightR (bp distances are modifiable by the user). Categories towards the top have higher priority when assigning clusters to their transcript-model context. b: Annotation of TCs from the Hela set. Y-axis shows the 9 annotation categories defined in panel A. Left bar plot shows the number of TCs falling into each category. Violin plot to the right shows the average pooled expression (log10-scaled TPM). Color indicates the overall context within gene models. c: Distribution of the 5–95% IQR for TCs from the Hela set. Color indicates the threshold (IQR = 10) to define sharp and broad classes. d: Examples of sharp and broad class TCs from panel C. Genome-browser style visualization as in Fig. 1b-c. Left panel shows a sharp CTSS distribution, right panel shows a broad CTSS distribution. e: Core promoter sequence patterns of sharp and broad classes of TCs from panel C. Y-axis shows information content as bits. X-axis shows genomic position relative to TC peak

