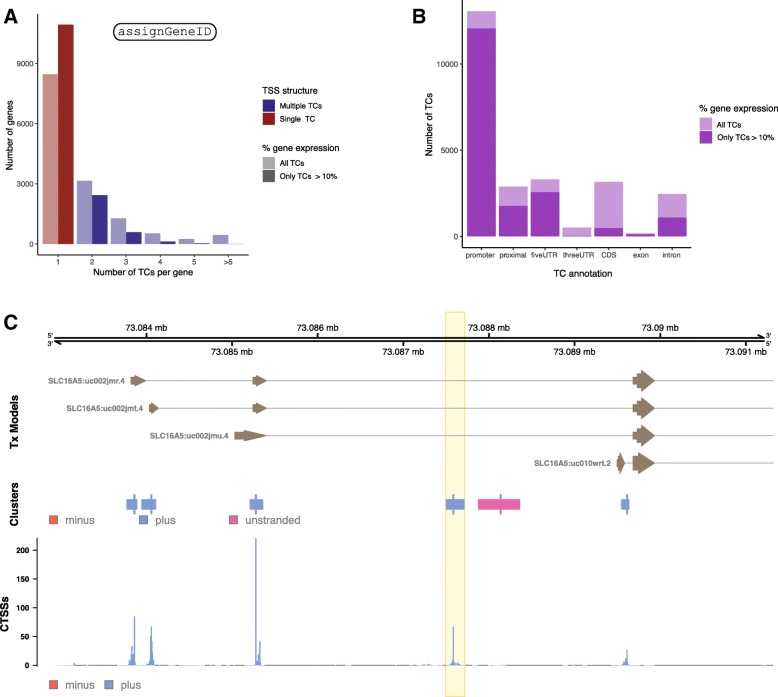
Fig. 4.
Analysis of alternative TSSs. a: Number of alternative TSS candidates per gene, as identified by TCs. X-axis shows number of TCs per gene. Y-axis shows the number of genes. Color indicates genes showing alternative TSS usage, having either a single or multiple TCs. Transparency indicates numbers before/after filtering away TCs making up less than 10% of total gene expression. b: Transcript context of TCs within genes. X-axis shows annotation categories from Fig. 1b. Y-Axis shows the number of TCs within each category. Transparency indicates whether the TC contributes > 10% of total gene expression. c: Genome-browser style example of an unannotated TC in the SLC16A5 gene. Organized as Fig. 1b-c. The novel alternative intronic TC is highlighted, found next to an intronic enhancer candidate

