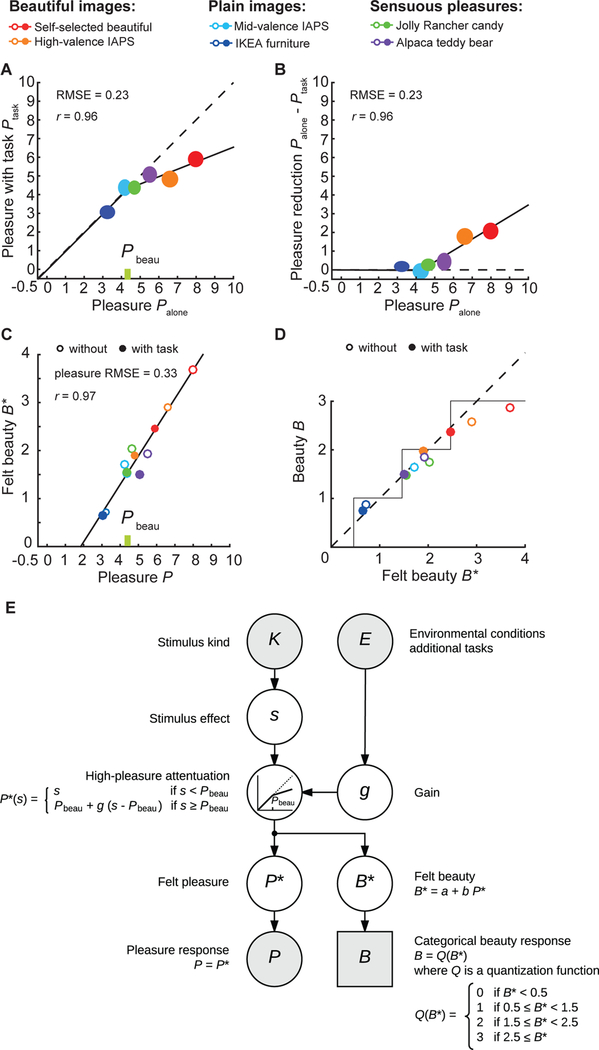
Figure 2. Relation between beauty and pleasure in Experiment 1.
(A) Effect of task on pleasure: average pleasure with vs. without added task. The all-pleasure attenuation model (not shown) for pleasure is Ptask = g Palone, where Palone is pleasure without task, Ptask is pleasure with task, and g is the task-dependent gain. Though not shown, it fits our data moderately well: 0.62 RMSE with 0.82 gain. However, looking at these data suggests that only high pleasure, exceeding some value Pbeau (green tick mark), is attenuated. The black line indicates the prediction of this high-pleasure attenuation model. This is like retained income after a progressive tax, with a higher tax on income exceeding a certain level. It predicts Ptask = Palone if Palone < Pbeau, and Ptask = Pbeau + g (Palone - Pbeau) if Palone ≥ Pbeau. The high-pleasure attenuation model fit has 0.23 RMSE with a high-pleasure gain of 0.61 and a high-pleasure threshold Pbeau = 4.29. The RMSE favors the high-pleasure attenuation model. Note that Pbeau lies between the pleasure thresholds P1 and P2 estimated for perhaps and definitely feeling beauty (green between dashed lines in Figure 1F). (B) Difference between average pleasure without and with task. The black line represents the predictions of the high-pleasure attenuation model. (A-B) Ellipses indicate mean ± SE. (C) Predicted felt beauty B* vs. pleasure for every stimulus kind (color), without (hollow ellipses) and with (filled ellipses) the 2-back task. (D) Average beauty B versus felt beauty B*, for each stimulus kind (color) without (hollow ellipses) and with (filled ellipses) the 2-back task. The observed B response is quantized (0 … 3), but our model assumes that the internal feeling B* is continuous, with a fixed-variance normal distribution. In this plot, the value of felt beauty is a maximum likelihood estimate of the mean, based on the histogram of quantized beauty responses. The dashed line represents equality. The solid line represents the quantization function B = Q(B*) (see panel E). (E) Generative model for mean beauty and pleasure responses. Only gray nodes are observed. Round nodes are continuous; square nodes are categorical. Arrows indicate a causal relation. We presume that each kind of stimulus K has a (mean) stimulus effect s. We model the effect of added task by high-pleasure gain g. High-pleasure gain is set to 1 for the (baseline) condition without task. (The high-pleasure gain with task is a degree of freedom.) Felt pleasure and beauty are determined by nonlinear compression of the stimulus effect s by high-pleasure gain g, where P* = s if s ≤ Pbeau, and P* = Pbeau + g (s - Pbeau) if s ≥ Pbeau, and B* = a + bP*. The continuous feeling of beauty B* is quantized to produce the categorical response B to the beauty question at the end of the trial. The pleasure response P (measured as rsteady) is the felt pleasure P*.

