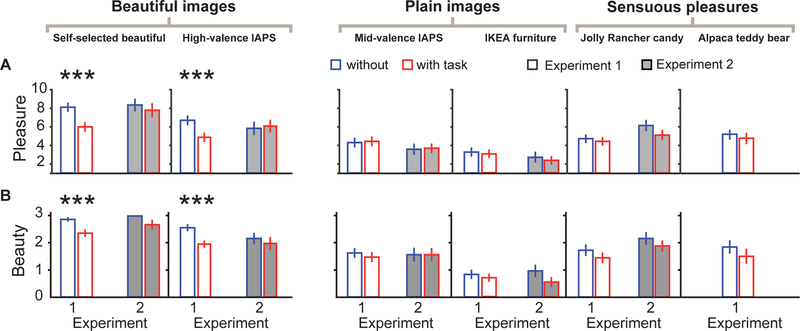
Figure 3. Main results of Experiment 2.
(A) Average steady–state pleasure rsteady and (B) final beauty judgments for each experiment without (blue) and with (red) an added task. The added task was 2-back (Expt 1, left, white bars) or digit-span (Expt 2, right, gray bars). Error bars represent mean ± 1 SE. Asterisks designate significant differences, with vs. without added task, according to post-hoc pairwise comparisons: *** p < 0.001. See also Figure S2.

