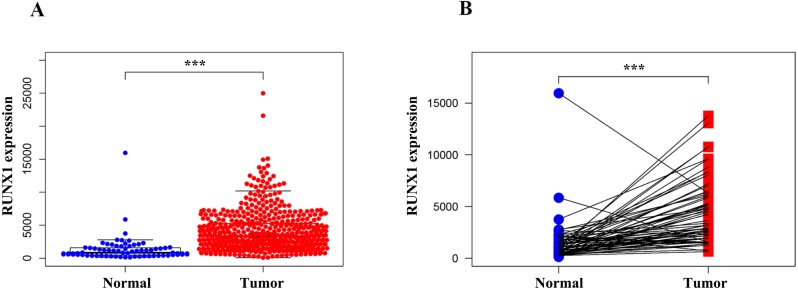
Figure 1. Comparison of RUNX1 expression between ccRCC tissues and normal tissues.
The Wilcoxon signed-rank test was used to compare the mRNA expression of RUNX1 in ccRCC tissues and normal tissues obtained from the TCGA database. (A) The expression of RUNX1 in ccRCC tissues (n = 539) was significantly higher than that in normal tissues (n = 72). (B) Compared with 72 paired normal tissues, ccRCC tissues exhibited obvious overexpression of RUNX1. RUNX1, Runt-related transcription factor 1; ccRCC, clear cell renal cell carcinoma; TCGA, The Cancer Genome Atlas ; *, p < 0.05 ; **, p < 0.01; ***, p < 0.001.

