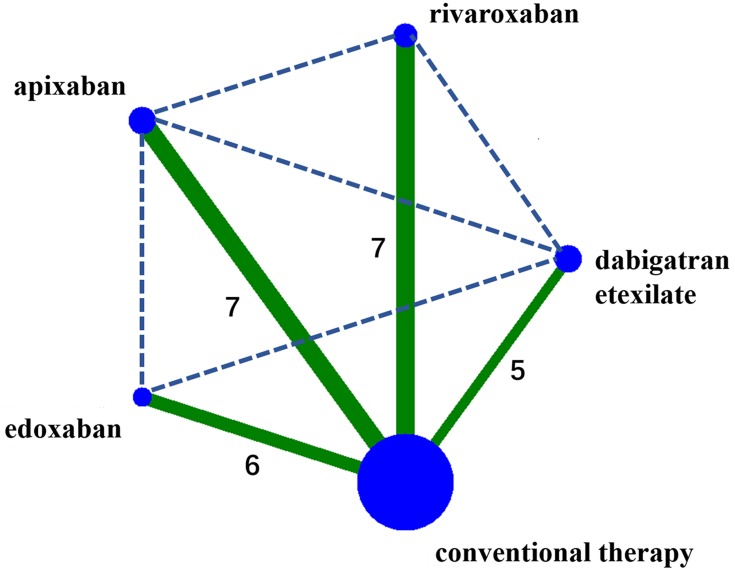
Figure 2.
The network plot for the Bayesian meta-analysis.
Notes: Solid lines represent direct evidence, and dashed lines represent the indirect evidence. The size of the nodes corresponds to the number of patients receiving the regimen, and the width of the lines corresponds to the number of studies comparing the connected treatments.

