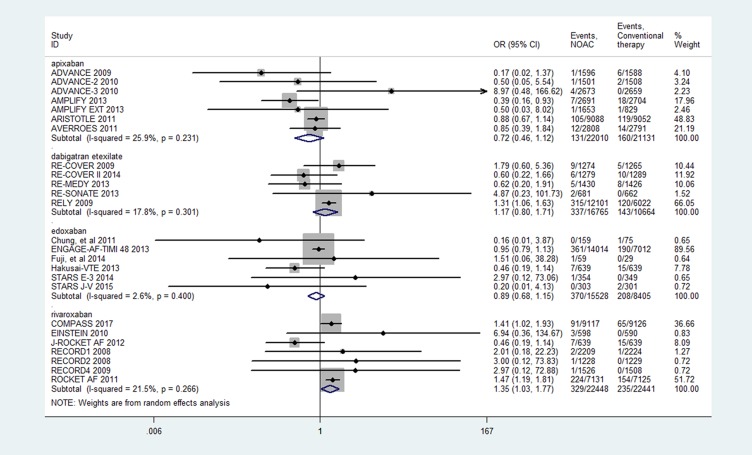
Figure 3.
Results of the pairwise meta-analysis.
Notes: Forest plots illustrating the results of a meta-analysis. The calculated summary effect demonstrates the superiority of various NOACs compared with conventional therapy in reducing the risk of major gastrointestinal bleeding. Horizontal lines represent the 95% CI of the effect size; solid diamonds indicate the mean effect size in single studies; hollow diamond shapes depict the summary effect size (diamond center) and the relative 95% CI (lateral edges); the black vertical lines represent the reference “1” line.

