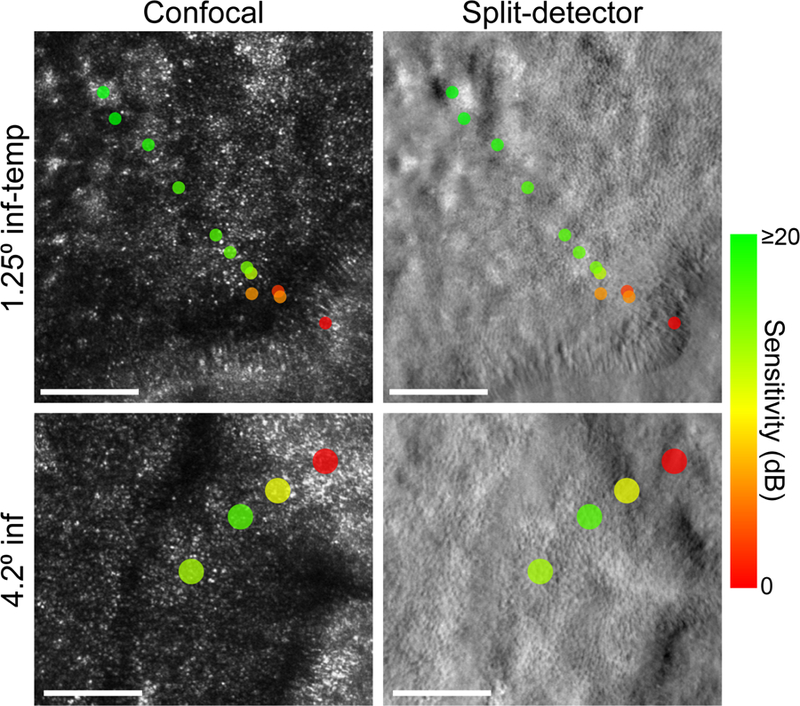
Figure 2. Cellular-scale retinal structure and function at the atrophic border measured with AOSLO.

Spatially-registered confocal (left column) and split-detector (right column) AOSLO images from the left eye of subject 13125. The top row images are centered roughly 1.25 degrees inferior-temporal from the fovea. The bottom row images were acquired 4.2 degrees from the fovea in the inferior retina. These retinal regions are outlined in white on the FAF image in Figure 1B. Colored markers indicate the visual sensitivity at each AO microperimetry test location. Markers are color-coded to reflect the measured sensitivity (in dB) and scaled to represent the size of the microperimetry stimulus on the retina (upper row: 3.5 arcmin diameter; bottom row: 7.0 arcmin diameter). Stimulus markers were placed after accounting for transverse chromatic aberration between the imaging and stimulus wavelengths. The scale bar represents the retinal diameter of the Goldmann III perimetry stimulus (0.43 degrees) routinely used in clinical microperimetry.
