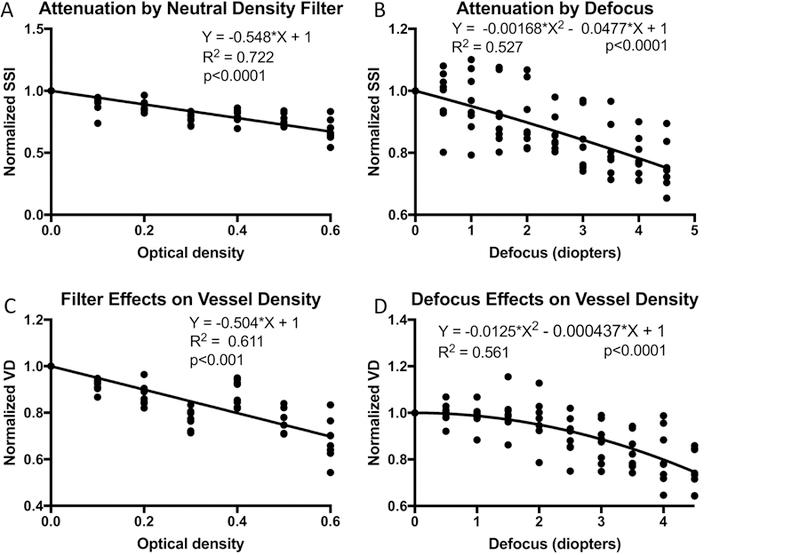
Figure 3.

Effects of experimental signal attenuation on macular retinal vessel density measured by the AngioVue OCTA system on human participants with healthy eyes. (A) The SSI, normalized by the unattenuated value, is plotted against the optical density of neutral density filters (NDF). (B) Normalized SSI is plotted against diopters of defocus. C) Normalized vessel density (VD) plotted against NDF optical density. D) Normalized VD plotted against diopters of defocus. Linear regression models were applied to the NDF plots while quadratic models were applied to the defocus plots. The y-intercepts of for the regression models have been set to 1.
* Scans obtained on Optovue AngioVue OCTA system
