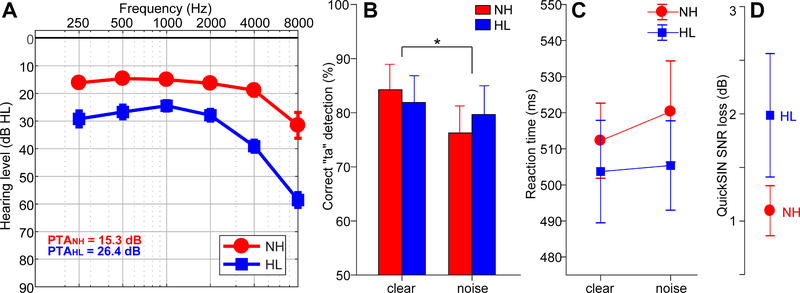
Figure 1: Audiometric and perceptual results.
(A) Audiograms for listeners with normal hearing (NH) and hearing loss (HL) pooled across ears. Hearing was ~10 dB better in NH vs. HL listeners. (B) Behavioral accuracy for detecting infrequent /ta/ tokens in clear and noise-degraded conditions. Noise-related declines in behavioral performance were prominent but no group differences were observed. (C) Reaction times (RTs) for speech detection were similar between groups and speech SNRs. (D) HL listeners showed more variability and marginally poorer QuickSIN performance than NH listeners. errorbars = ± s.e.m., *p< 0.05.

