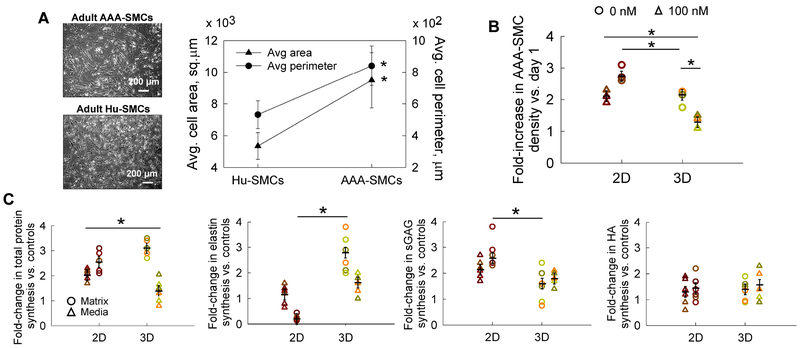
Figure 2.
(A) Representative phase-contrast images of adult healthy Hu-SMCs and AAA-SMCs cultured in this study. Significant differences in average cell area and perimeter were noted between the two cell types. Data shown represents mean ± standard error in respective cases. Scale bar: 200 μm. (B) Fold increase in AAA-SMC density within 2D and 3D cultures, in the presence or absence of exogenous 100 nM GSNO. Data shown represents mean ± standard error of cell count after 21 days of culture, normalized to initial seeding density (n = 3/ condition). Cell densities were quantified using a fluorometric assay detailed earlier. (C) Fold-changes (vs. GSNO-free controls) in total protein, elastin, sGAG, and HA, deposited within cell matrix or released into pooled media, by human AAA-SMCs, in 2D and 3D cultures, in the presence of 100 nM GSNO. The total protein amounts were quantified using a BCA protein assay, elastin amounts using a Fastin Assay kit, sGAG amounts using a quantitative dye-binding sGAG assay kit, and HA amounts using a hyaluronan enzyme-linked immunosorbent quantitative assay. Quantitative results were obtained from cell matrix layers or pooled media after 21 days of culture and normalized to cell count within respective cases (n = 6/ condition). Data were analyzed using one-way ANOVA followed by Tukey’s HSD post-hoc testing, assuming unequal variance and differences deemed significant for p < 0.05 between respective cases. Data shown represents mean ± standard error in respective cases. The absolute amounts of each protein per cell were listed in Table 2 for baseline purposes.

