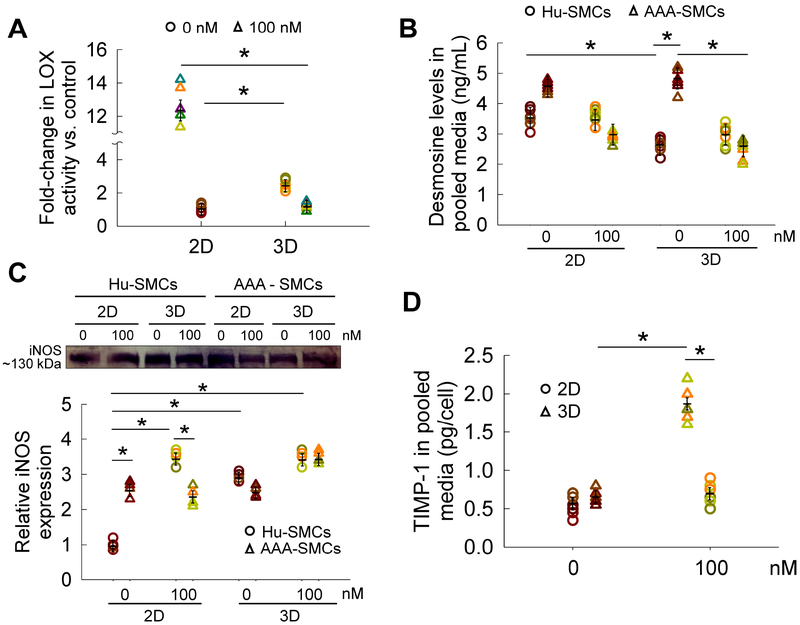
Figure 3.
(A) Fold-changes in LOX enzyme functional activity within cell matrix and pooled media of AAA-SMC cultures, quantified using an Amplex Red® fluorometric assay and quantified per cell. Cells were exposed to 100 nM GSNO while controls received no GSNO. The absolute amounts of LOX functional activity per cell were listed in Table 2 for baseline purposes. (B) Desmosine levels in pooled media collected from 2D/ 3D Hu-SMCs or AAA-SMC cultures, over the 21-day period, in the presence or absence of GSNO. (C) iNOS protein expression was quantified from western blot analysis. Representative bands are shown in the insert for comparison. iNOS protein expression by AAA-SMC cultures was normalized to that in 2D GSNO-free cultures of healthy SMCs. (D) Similarly, the release of TIMP-1 into pooled media was quantified using a TIMP-1 ELISA assay. GSNO (0 or 100 nM) was supplemented to AAA-SMC cultures in 2D or 3D cultures over 21 days. Data were analyzed using one-way ANOVA followed by Tukey’s HSD post-hoc testing, assuming unequal variance and differences deemed significant for p < 0.05. Data shown represent mean ± standard error of quantified data and normalized to cell count within respective cases (n = 6 per condition).

