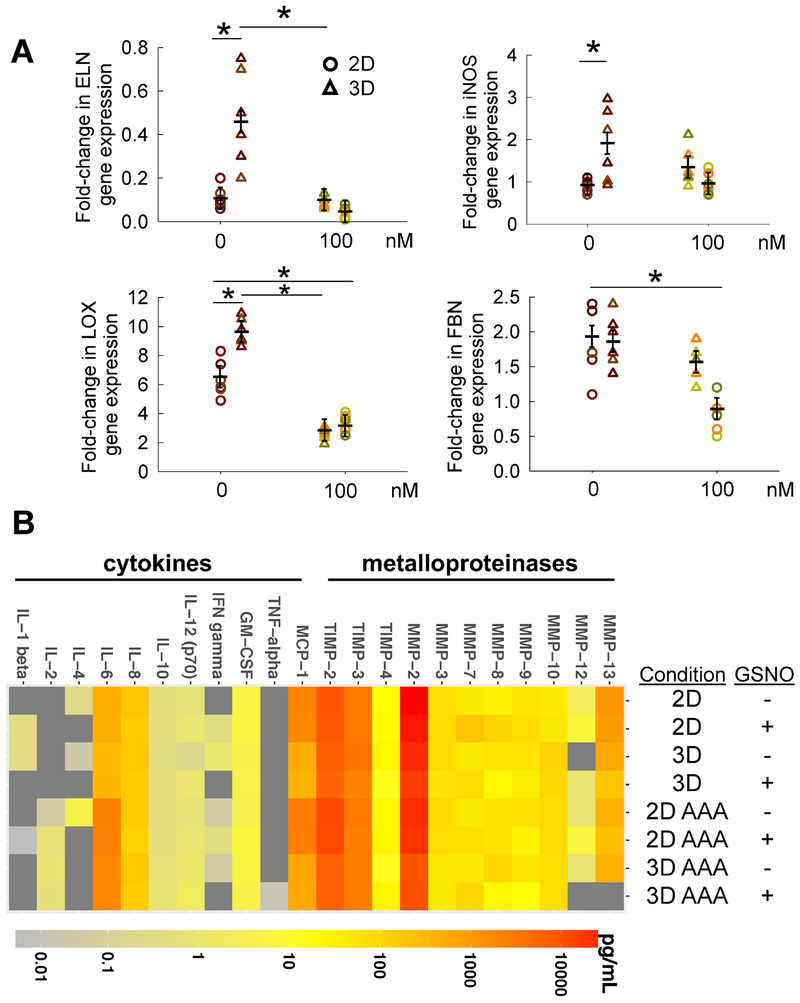
Figure 4.
(A) Lavik method (ΔΔCt method) was used for relative quantification of the fold changes in ELN, iNOS, LOX, and FBN genes in AAA-SMCs, after addition of GSNO (0 or 100 nM) within 2D or 3D cultures for 21 days. The gene expressions obtained from qRT-PCR analysis within AAA-SMCs were first normalized to housekeeping gene (18S) expression within respective cultures, and further normalized to respective gene expressions within healthy Hu-SMCs cultured under similar conditions. Data were analyzed using one-way ANOVA followed by Tukey’s HSD post-hoc testing, assuming unequal variance and differences deemed significant for p < 0.05. Data shown represent mean ± standard error (n = 6 independent data points per condition). (B) Heat map showing the amounts of cytokines, chemokines, and MMPs/TIMPs released by healthy and AAA SMCs, in 2D and 3D cultures, in the presence or absence of 100 nM GSNO, as measured using laser bead immunoassay.

