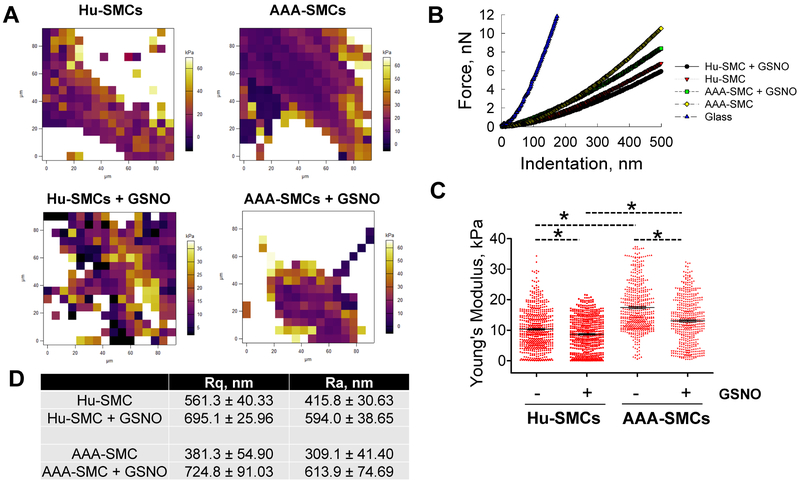
Figure 6.
(A) Representative force maps of healthy Hu-SMCs (left panels) and AAA-SMCs (right panels) treated with 100 nM GSNO (lower panels). Background from petri dish was subtracted in these images. Representative force-indentation curves (B) and average Young’s Modulus (C) of these cells cultured on 2D substrates, in the presence or absence of 100 nM GSNO. The black dotted lines in (C) represent the arithmetic averages in respective cases, i.e., 10.33 ± 0.2624 KPa for untreated Hu-SMCs (n = 605), 8.674 ± 0.2491 KPa for Hu-SMCs receiving GSNO (n = 550), 17.41 ± 0.3405 KPa for untreated AAA-SMCs (n = 524), and 13.03 ± 0.3498 KPa for AAA-SMCs receiving GSNO (n = 469). (D) The surface roughness parameters Rq and Ra in Hu-SMCs and AAA-SMCs, in the presence of absence of GSNO. Data were analyzed using one-way ANOVA followed by Tukey’s HSD post-hoc testing, assuming unequal variance and differences deemed significant for p < 0.05. Data shown represent mean ± standard error (n = 6 independent data points per condition).

