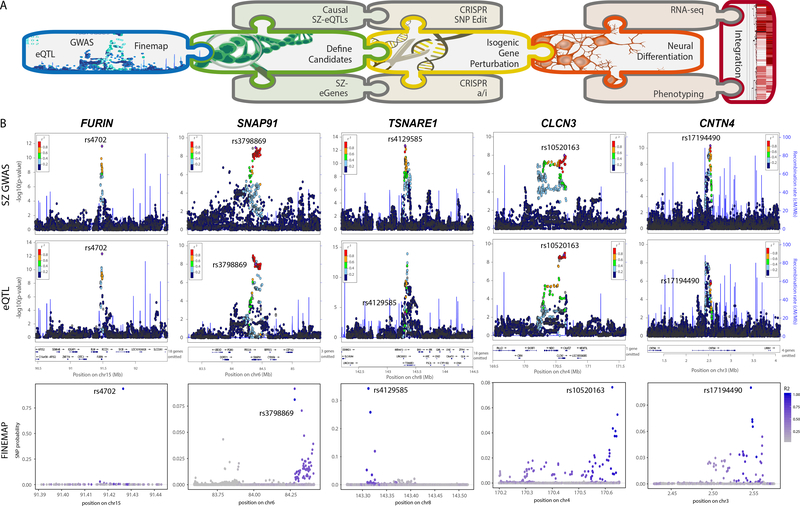
Figure 1. Prioritization of SZ-SNPs and SZ-genes for functional validation.
A. Schematic summary of analysis pipeline. B. Integration of GWAS (top), eQTL (middle) and fine-mapping (bottom) analysis for FURIN, SNAP91, TSNARE1, CLCN3 and CNTN4. Only FURIN shows evidence of having a single, high probability (0.94) putative causal SNP-eQTL. GWAS results derived from 34,241 cases, 45,604 controls and 1,235 trios 1 and association tested using additive logistic regression model and meta-analysis using an inverse-variance weighted fixed effects model. eQTL statistics generated from 467 DLPFC samples 12 using an additive linear model implemented, and significance assessed using t test.

