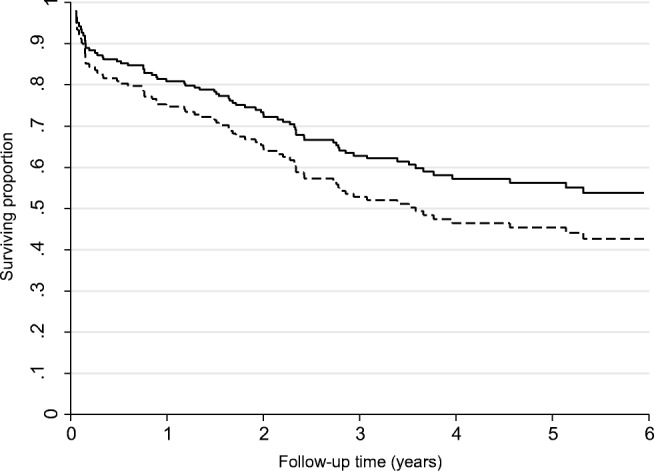
Fig. 1.

Kaplan-Meier curve showing the overall survival of colorectal cancer patients by the amount of F. nucleatum DNA in colorectal tumor tissue (2−∆CT); continuous line indicates low tumor F. nucleatum; broken line indicates high tumor F. nucleatum. In the adjusted models, high F. nucleatum was associated with poorer OS compared to lower levels (HR 1.68, 95% CI 1.02–2.77, p = 0.04)
