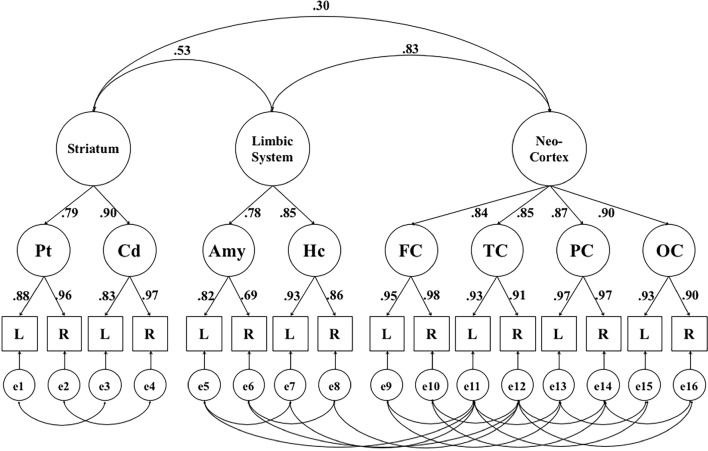
Fig. 2.
Hierarchical factor model portraying the relationship between [11C]raclopride D2/3DR BPND in striatum, limbic system, and neocortex. The figure shows standardized factor loadings and factor correlations for this model. Pt putamen, Cd caudate, Hc hippocampus, Amy amygdala, FC frontal cortex, OC occipital cortex, TC temporal cortex, PC parietal cortex, L left hemisphere, R right hemisphere, e error. Errors represent hemisphere-specific variance and hemisphere-specific measurement error. For any indicator, the variance accounted for by its error term corresponds to one minus the square of its factor loading

