Fig. 3.

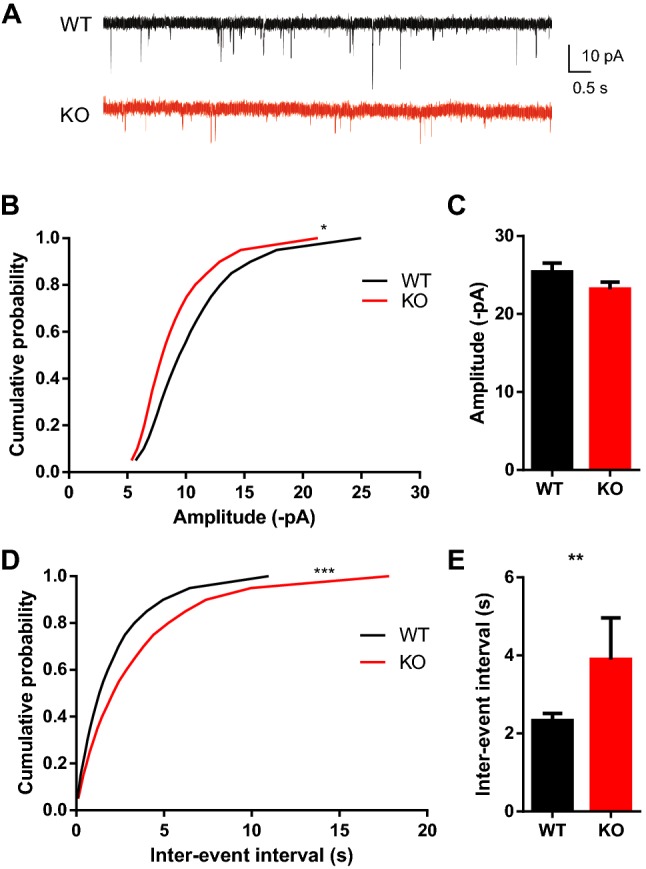
Reduction of the amplitude and frequency of spontaneous mEPSCs in SRF KO granular neurons. a Sample traces from WT and SRF KO granular neurons. Cumulative probability plots showing mEPSCs amplitude (b) and frequency (d) in n = 16 WT cells and n = 14 SRF KO neurons (Kolmogorov–Smirnov test, *p = 0.01 and ***p < 0.001, respectively). Bar graphs in c and e represent averaged amplitudes and frequencies of mEPSCs (Mann–Whitney test, p = 0.1246, ns and **p = 0.003, respectively)
