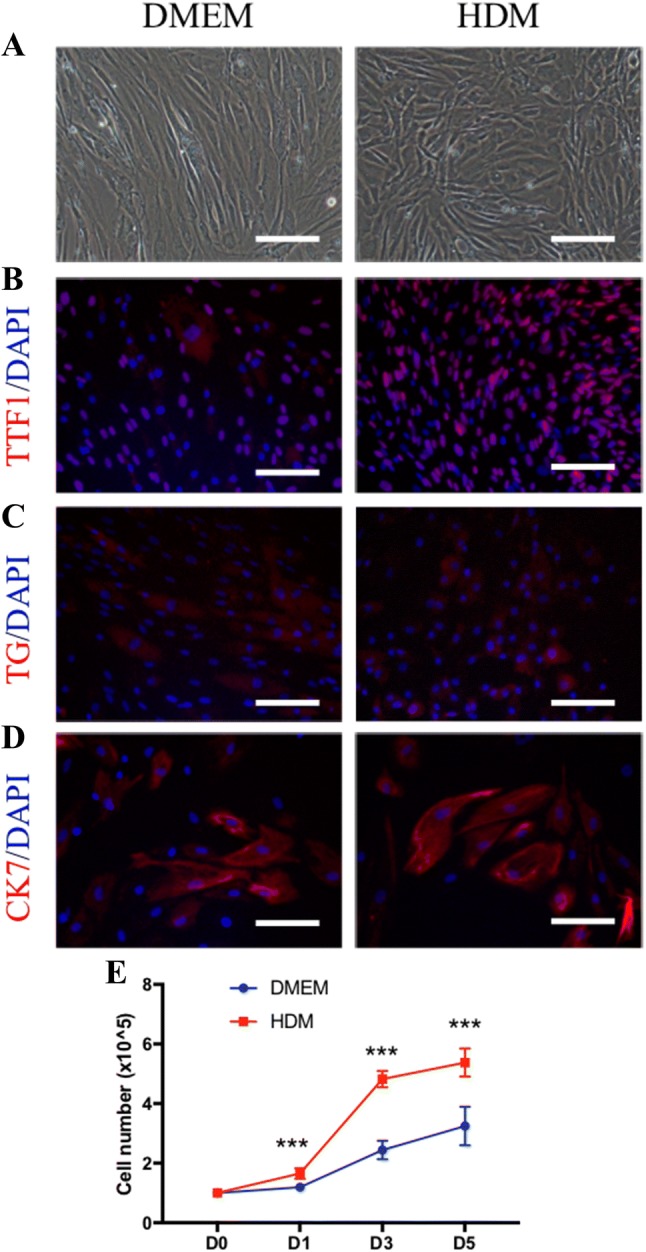
Fig. 2.

Characteristics of isolated cells after subculture. A Cells were cultured in DMEM (left panel) and HDM (right panel) after passage. Phase-contrast image of cell morphologies. B–D Immunofluorescent stained images of the thyroid cell-specific marker TTF1, TG and the epithelial cell marker CK7. Nuclei were stained with DAPI (blue). E TTF1: thyroid transcription factor-1; TG: thyroglobulin; CK7: cytokeratin 7; DAPI: 4′,6-diamidino-2-henylindole. Scale bar = 50 lm. The number of thyroid cells cultured in DMEM and HDM for 1, 3 and 5 days. ***p < 0.001 (two-way t test), (n = 5)
