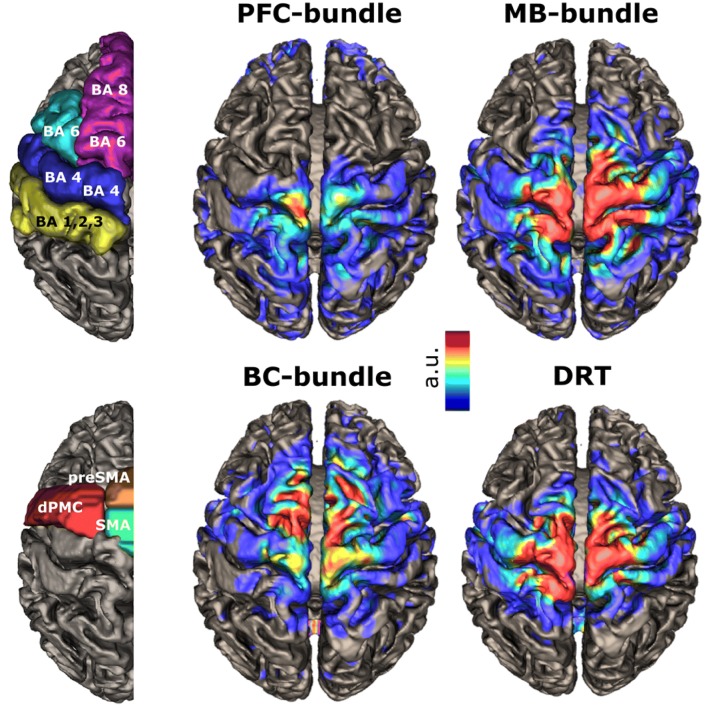
Fig. 9.
Cortical projection fields. The left panel indicates parcellation of sensory–motor cortices based on gyral anatomy, Brodmann area and probabilistic mapping as shown in Fig. 2. The right panel indicates the cortical projection fields of different motorMFB bundles and the DRT. Color coding indicates probability of occurrence of terminating fiber streamlines in the entire group (in arbitrary units)

