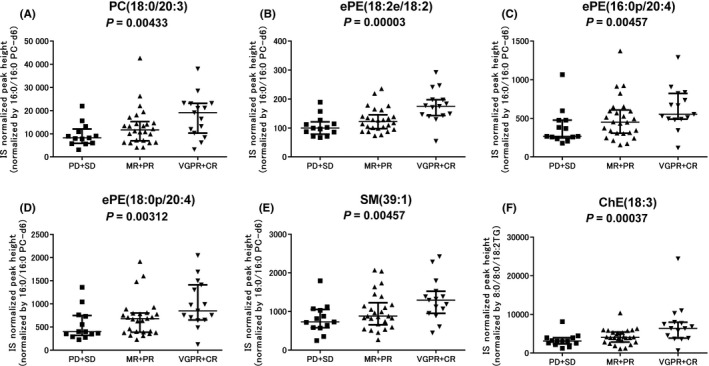
Figure 1.

Comparison of lipid metabolite levels in multiple myeloma patients according to the response to bortezomib and low‐dose dexamethasone therapy. Six representative metabolites associated with the response to bortezomib and low‐dose dexamethasone therapy are shown. A, Phosphatidylcholine (PC)(18:0/20:3). B, Ether‐type phosphatidylethanolamine (ePE)(18:2e/18:2). C, ePE(16:0p/20:4). D, ePE(18:0p/20:4). E, Sphingomyelin (SM)(39:1). F, Cholesterol ester (ChE)(18:3). Graphs show the medians and interquartile ranges. Statistical significance was assessed using the Jonckheere‐Terpstra trend test. CR, complete response; IS, internal standard; MR, minor response; PD, progressive disease; PR, partial response; SD, stable disease; VGPR, very good partial response
