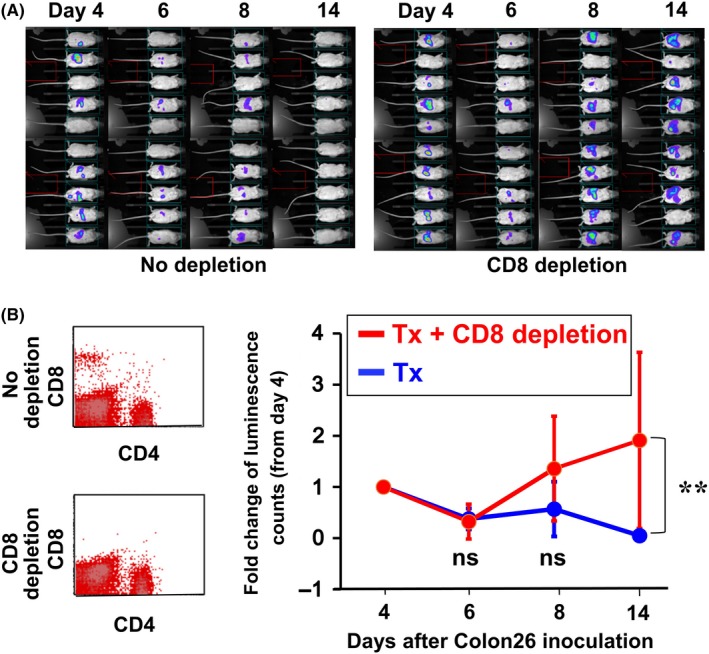
Figure 7.

Contribution of CD8+ T cells to the therapeutic effect of the ES‐ML/IFN. An anti‐CD8 antibody was administrated ip at d −3, −1, and 6 (50 μg/injection/mouse). Colon26/Luc cells (1 × 10⁶ cells/mouse) were injected ip on d 0, and mice were treated with the ES‐ML/IFN as described in Figure 4. Cancer growth was monitored by in vivo luminescence analysis from d 4. A, Imaging data of luciferase assay are shown. B, The presence of CD4+ and CD8+ T cells in peripheral blood was examined to confirm depletion of CD8+ T cells at d −1. C, Fold changes in luminescence counts of each mouse in comparison with counts observed on d 4. The difference between the two groups was statistically significant (**P < .01, linear mixed model)
