Figure 2.

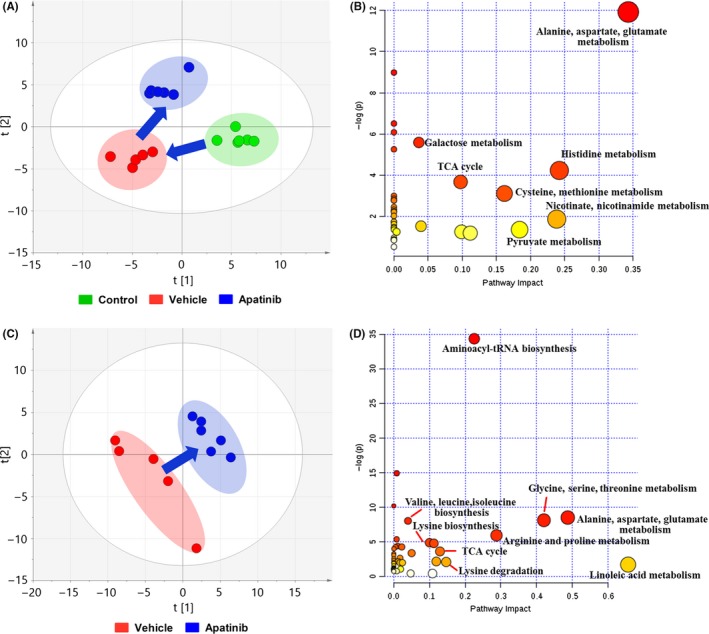
Metabolic changes of serum and tumor. (A) Partial least squares discriminant analysis (PLS‐DA) of metabolite changes in serum. (B) Impact analysis of serum metabolic sets modulated by apatinib relative to vehicle group. (C) PLS‐DA of metabolite changes in tumor. (D) Impact analysis of tumor metabolic sets modulated by giving apatinib. TCA, tricarboxylic acid
