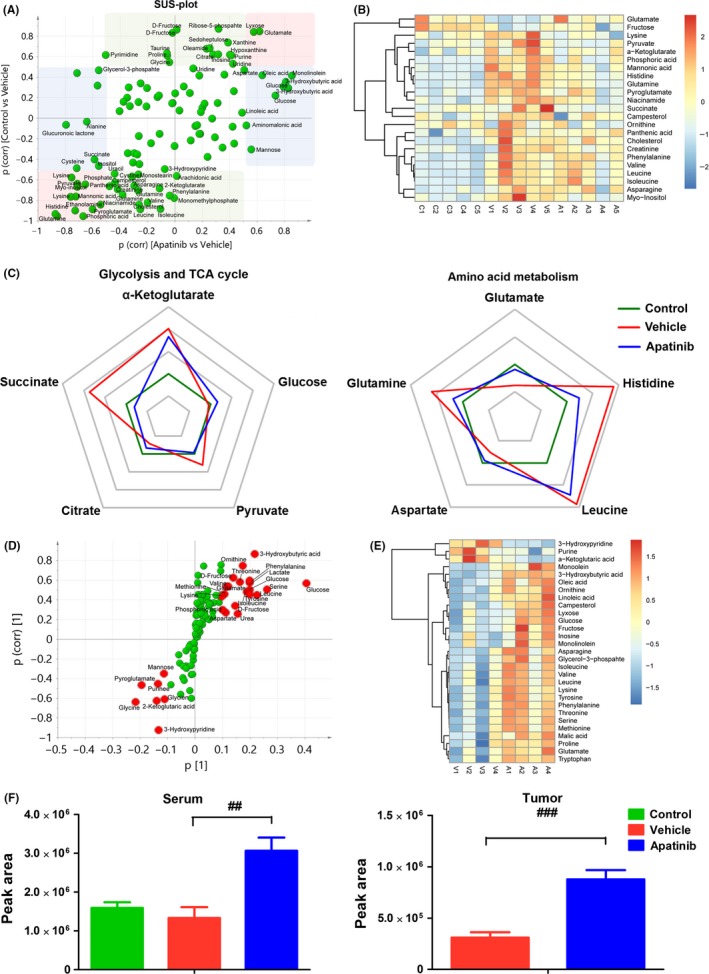
Figure 3.

Changes in key metabolites in serum and tumor. (A) Shared‐and‐unique‐structures plot (SUS‐plot) of serum correlating orthogonal partial least squares discriminant analysis (OPLS‐DA) models of apatinib vs vehicle (x‐axis) and control vs vehicle (y‐axis). Accordingly, the variables in the lower left corners are compounds that showed the reverse effect of apatinib on A549 xenografts (red box). However, metabolites located along the axes are specifically altered in the vehicle group (green boxes) and in the apatinib group (blue boxes). (B) Heat map of serum metabolites disrupted by s.c. inoculated tumor and normalization of this change by apatinib. Red indicates upregulated metabolites whereas blue indicates downregulated metabolites. (C) Phase diagram of the 10 key metabolites in serum involved in glycolysis, the TCA cycle and amino acid metabolism. (D) S‐plot analysis of metabolites in tumor between vehicle and apatinib‐treated groups. Metabolite ions with variable importance in projection (VIP) value > 1 are marked in red. (E) Heat map of regulated metabolites in tumor after treatment with apatinib compared with vehicle group. Red indicates upregulated metabolites whereas blue indicates downregulated metabolites. (F) Peak area of 3‐hydroxybutyric acid (3‐HB) in serum and tumor based on metabolite detection by gas chromatography‐mass spectrometry. ## P < .01, ### P < .001 vs vehicle
