
Figure 4.
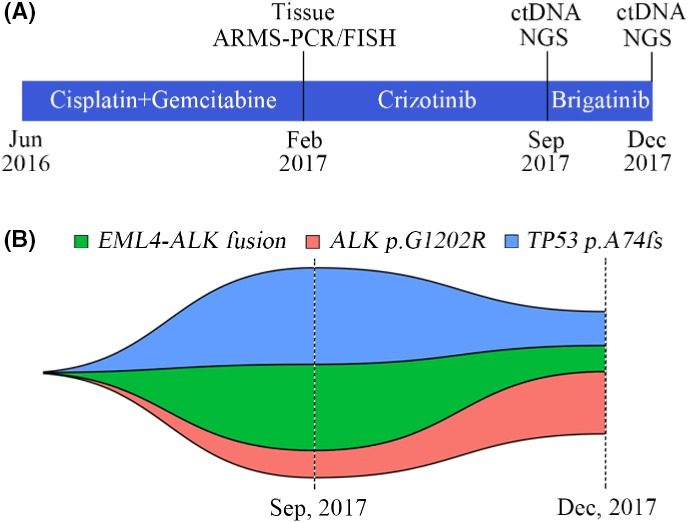
Longitudinal analysis of plasma ctDNA ALK alterations from a patient. A, Timeline indicates different treatments. B, Map of clonal evolution. Two plasma ctDNA samples analyzed by next‐generation sequencing (NGS) were collected during different treatments. Different colors represent different gene mutations. ALK, anaplastic lymphoma kinase; ARMS, amplification refractory mutation system; ctDNA, circulating tumor DNA; fs, frameshift mutation