
Figure 2.
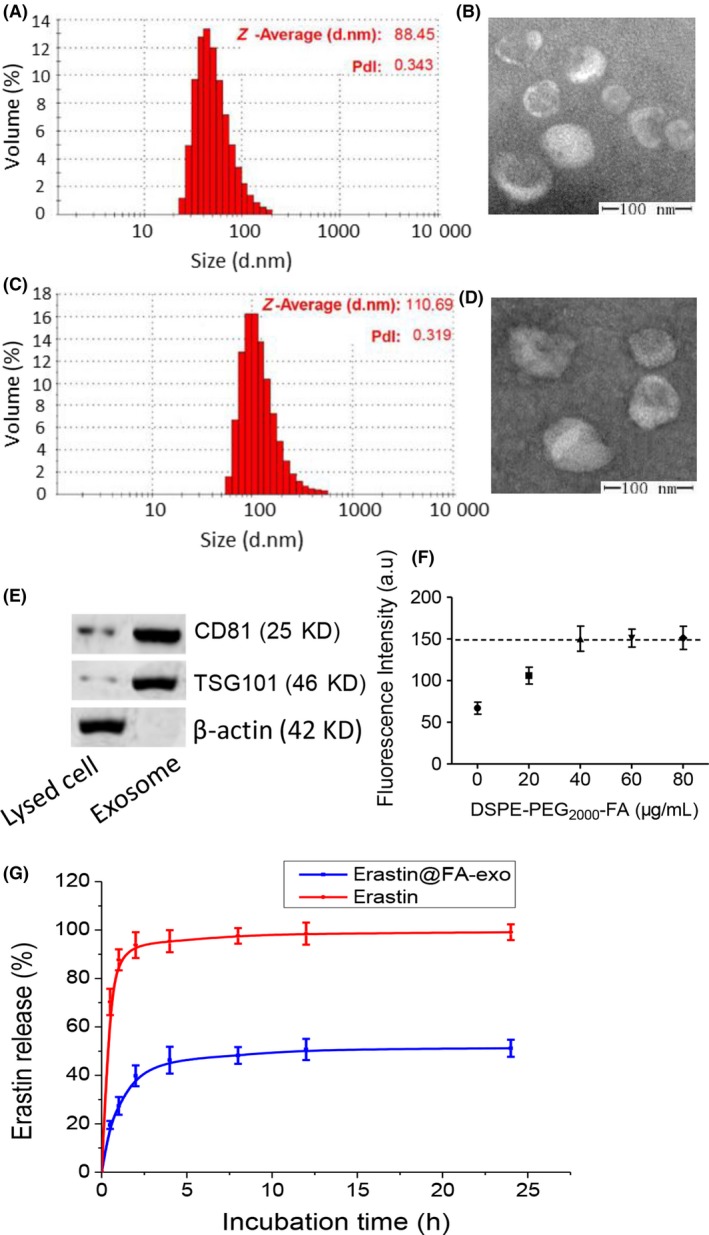
Characterization of erastin@FA‐exo. A, Size distribution of naive exosomes determined by dynamic light scattering (DLS). B, Representative transmission electron microscopy (TEM) image of naive exosomes derived from HFL‐1 cells. C, Size distribution of erastin@FA‐exo determined by DLS. D, TEM image of erastin@FA‐exo. E, TSG101 and CD81 expressions of exosomes by western blot. F, The uptake of erastin@FA‐exo with different DSPE‐PEG 2000‐FA contents was detected by fluorescence quantitative analysis. G, In vitro release of erastin from erastin@FA‐exo in pH 7.4 by HPLC