Figure 4.

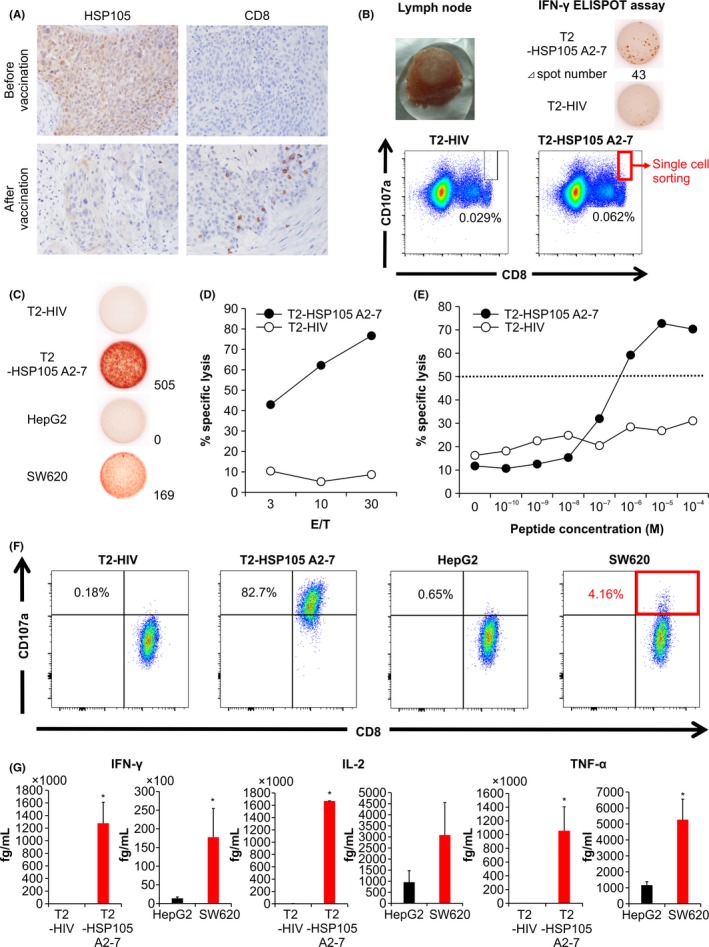
Immunological monitoring of patient no. 9 and establishment of a tissue‐derived CTL clone. A, Immunohistochemical analysis of heat shock protein 105 (HSP105) and CD8 expression before and after vaccination. Magnification, ×200. B, Cervical lymph node resected after the fifth vaccination (upper left panel) showed increased number of HSP105 A2‐7 peptide‐specific CTLs in the γ‐interferon (IFN‐γ) enzyme‐linked immunospot (ELISPOT) assay (upper right panels). FACS analysis of CD8+CD107a+ T cells showing reactivity against T2 cells pulsed with an HIV peptide (lower left panel) or the HSP105 A2‐7 peptide (lower right panel). Single CD8+CD107a+ T cells reactive against the HSP105 A2‐7 peptide‐pulsed cells were used to establish a CTL clone. C, IFN‐γ production by the CTL clone measured by the IFN‐γ ELISPOT assay. T2 cells pulsed with HSP105 A2‐7 or HIV peptides and SW620 and HepG2 cells were used as targets at the effector / target (E/T) ratio of 0.2. D, Cytotoxic activity of the CTL clone against HIV peptide‐ or HSP105 A2‐7 peptide‐pulsed T2 cells was measured at the E/T ratios of 3, 10, and 30 by the cytotoxicity assay. E, The avidity of the CTL clone was tested using T2 cells pulsed with different concentrations of HSP105 A2‐7 or HIV peptides; E/T ratio of 10. The peptide concentration at which the curve crossed the 50% cytotoxicity line (dotted) was defined as the recognition efficiency of the clone. F, Surface CD107a expression by the CTL clone was analyzed in response to the indicated target cells. G, Production of IFN‐γ, interleukin‐2 (IL‐2), and tumor necrosis factor‐α (TNF‐α) by the CTL clone (1.0 × 10⁵ cells per well) after 24‐h of coculture with the indicated target cells (5 × 10⁴ per well). Data represent the mean ± SD of 2 measurements. *P < .05
