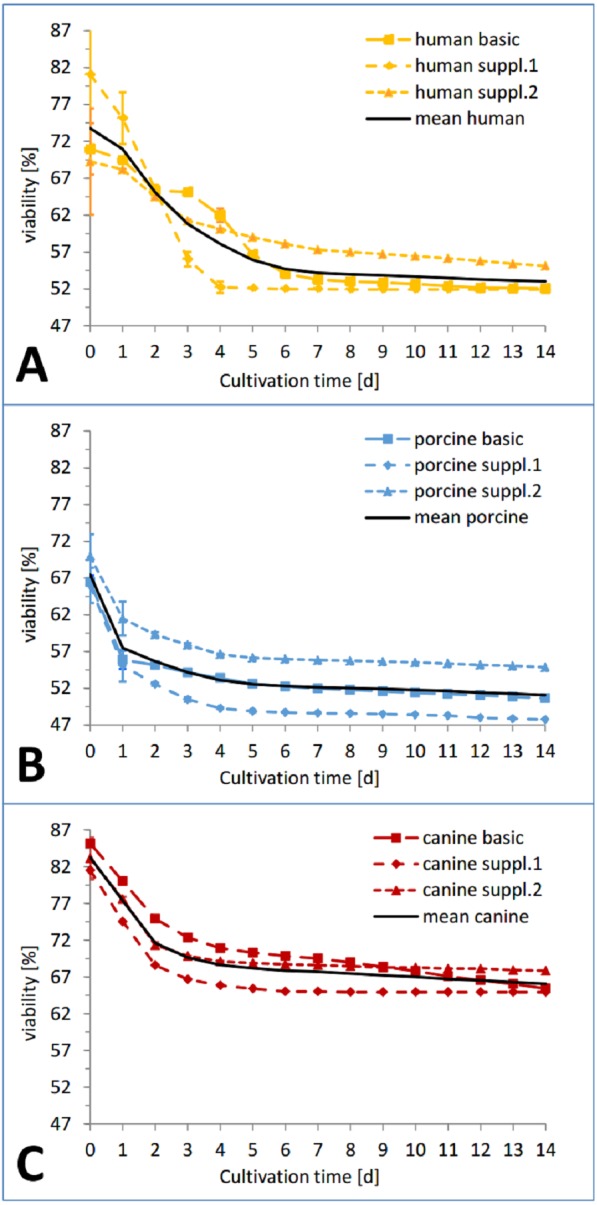
Figure 5. Viability trend of the skin samples in percent over 14 days of cultivation, comparing species.

Viability trend (measurement timepoints connected via trend-lines) in percent relative to the corresponding positive control for the three investigated cultivation conditions: basic medium, supplement mixture 1 and supplement mixture 2 in order to compare differences between species. All the data points are mean values from three skin punches cultivated in the same condition, measured n = 2. (A) Human skin, (B) porcine skin, (C) canine skin.
