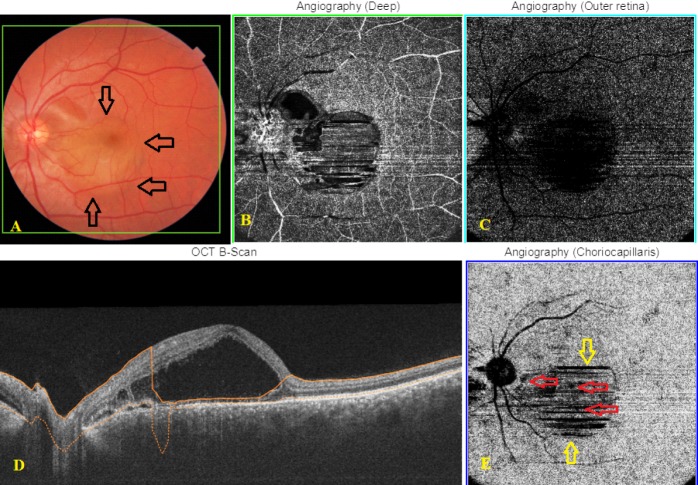
Figure 5.
Left eye color fundus picture, Optical Coherence Tomography (OCT) B-scan and Optical Coherence Tomography Angiography (OCTA) images of a 32-year-old male patient with acute Vogt- Koyanagi- Harada (VKH) disease obtained from Triton™ DRI swept‐source optical coherent tomography (SS‐OCT) instrument. Color fundus picture (A) showing optic disc hyperemia and serous macular detachment (black arrows). OCTA scans depicting signal loss at the level of deep (B) and outer retinal (C) layers in the area of subretinal fluid. OCT B-scan (D) image illustrating serous retinal detachment along with an increased choroidal thickness. OCTA image at the level of choriocapillaris (E) showing severe motion artefacts (yellow arrows) and multiple dark foci in variable sizes (red arrows)

