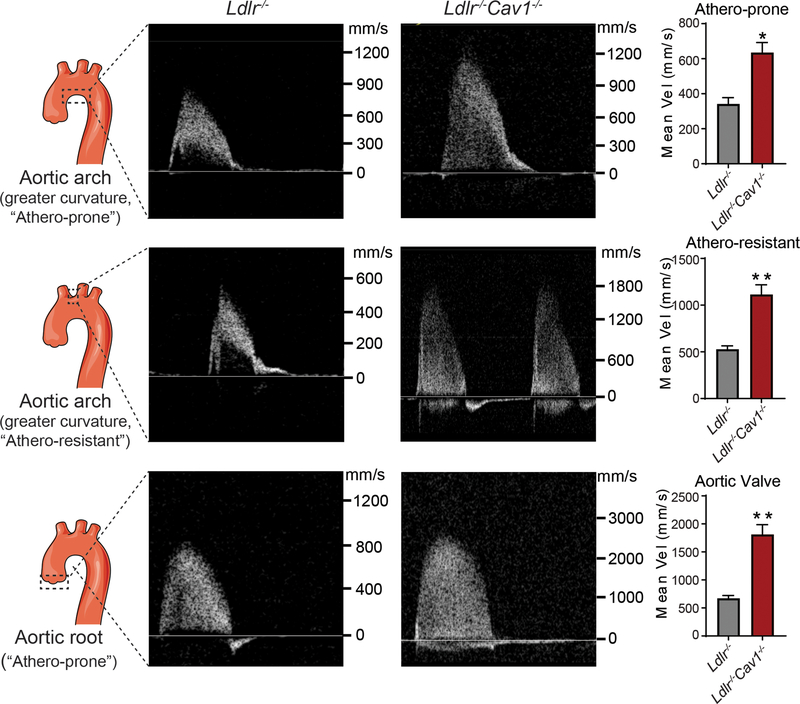
Figure 5. Flow velocity analysis of athero-prone and athero-resistant sites of aortic arch and valve in Ldlr−/− and Ldlr−/−Cav1−/− mice.
Age-matched (two months old) male mice were used to assess the blood flow dynamics at the “athero-prone” and “athero-resistant” sites of aorta and aortic valves in Ldlr−/− and Cav1−/−Ldlr−/− mice by serial echo. Quantification of mean velocity is shown in the right panels and represents the mean ± SEM (n=3 per group, P=0.0122 for athero-prone, p=0.0059 for athero-resistant and p=0.0034 for aortic valve). Data were analyzed by an unpaired two-sided Student’s t-test. * P<0.05 and ** P<0.01 compared to Ldlr−/− group.

