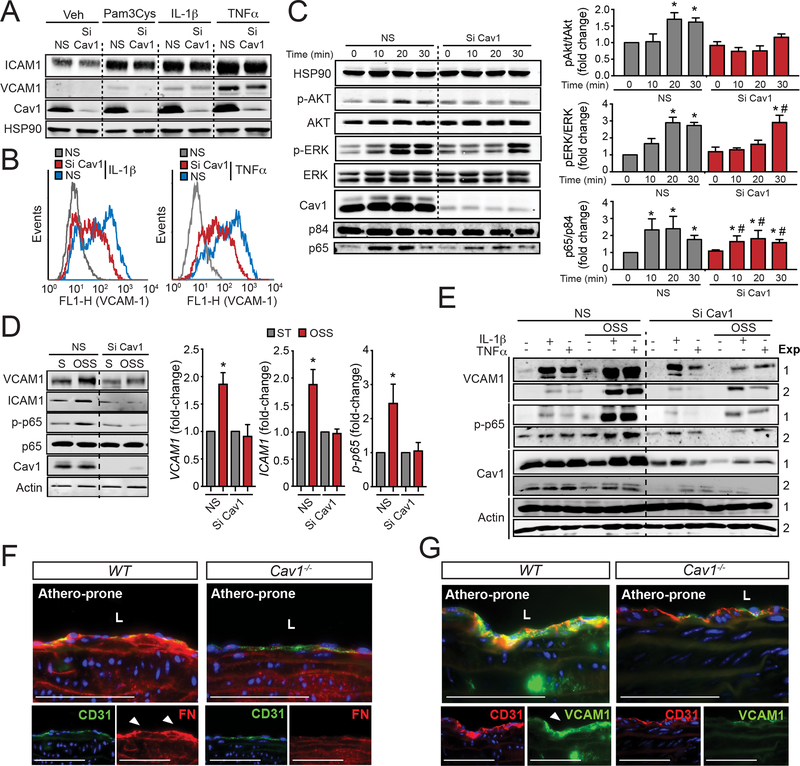
Figure 7. Loss of Cav1 impairs cytokine and oscillatory shear stress- induced EC inflammation.
(A) Representative Western Blot analysis of ICAM1, VCAM1 and Cav1 expression in HAECs transfected with non-silencing siRNA (NS) or Cav1 siRNA (Si Cav1) and treated with Pam3Cys (TLR2 ligand, 10 ng/mL), IL-1β (10 ng/mL) and TNFα (10 ng/mL) for 8 h. HSP90 was used as a loading control. (B) Flow cytometry analysis of VCAM1 and ICAM1 membrane expression in HAECs transfected with NS or Si Cav1 and treated with, IL-1β (10 ng/mL, left panel) and TNFα (10 ng/mL, right panel) for 8 h. (C) Time course analysis of p-AKT (Ser473), AKT, p-ERK, ERK, Cav1 and HSP90 (loading control) expression in HAECs transfected with NS or Si Cav1 and treated with, IL-1β (10 ng/mL, left panel) for 0, 10, 20 and 30 min. Nuclear translocation of p65 is shown in the bottom panel. P84 was used as a nuclear marker. Right panels show the quantification (mean ± SEM of n=3 independent experiments). (D) Representative Western Blot analysis of VCAM1, ICAM1, p-p65, p65, Cav1 and actin in HUVECs transfected with NS or Si Cav1 in static (S) or exposed to oscillatory shear stress (OSS; 1±3 dyne/cm2) for 24 h. Graphs in the right show quantification analysis and data represents mean ± SEM of n=3 independent experiments. (E) Representative Western Blots analysis of VCAM1, p-p65, Cav1 and actin in HUVECs transfected with non-silencing siRNA or Cav1 siRNA exposed or not to OSS for 24 h and treated with IL-1β (12,5 pg/mL) and TNFα (0.12 ng/mL) for 8 h. (F and G) Representative immunofluorescence images of FN and CD31 (F) and VCAM1 and CD31 (G) in the lesser curvature of 6 months old WT mice. Data presented in C and D were analyzed by one-way ANOVA with Bonferroni correction for multiple comparisons. * indicates P < 0.05 compared with NS at time 0 or static conditions, and # indicates P < 0.05 compared to Si Cav1 at time 0. Scale bar: 100 μm.

