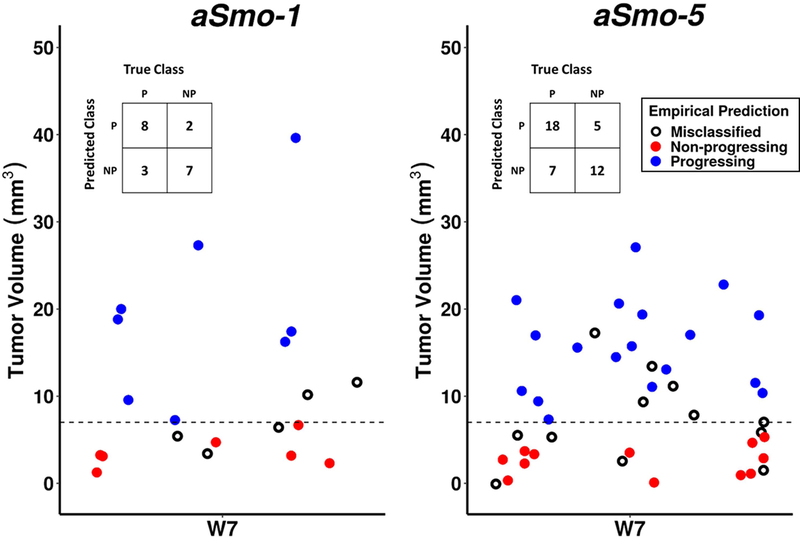
Figure 8. Empirical classification of aSmo-1 and aSmo-5 longitudinal progression data.
Initial classification utilized positive volume change between W5 and W7, and tumor volume threshold of 7-mm3 at W7 (dashed line) as discrimination criteria. Tumors meeting these criteria were classified ‘Progressing’ (blue, P), and those not meeting these criteria were classified ‘Non-progressing’ (red, NP). These predictions were compared to observed outcome, and mismatches between prediction and outcome were considered ‘Misclassified’ (black, open circles). In the aSmo-1 MBs, the true positive rate was 72.7% and the true negative rate was 77.8%. In the aSmo-5 MBs, the true positive rate was 72.0% and the true negative rate was 70.6% (see confusion tables, insets).

