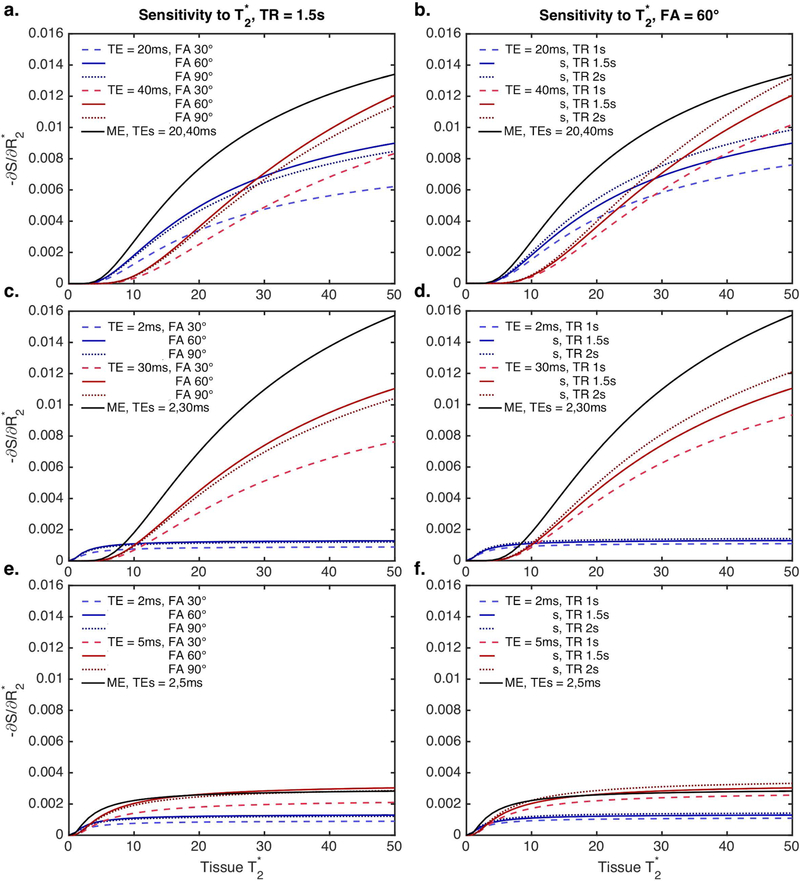
Figure 1.
Signal sensitivity to T2* effects, as a function of tissue T2*, for a range of pulse sequence combinations (left: TR = 1.5s, FA = 30, 60, and 90º; right: FA = 60º, TR = 1, 1.5, and 2 s). a, b: TEs = 20 and 40 ms (representative of a typical dual-echo EPI-based sequence); c, d: TEs = 2 and 30 ms (representative of a spiral-based acquisition); e, f: TEs = 2 and 4ms. The multi-echo T2* sensitivity is shown in black (no variation for TR and FA), while the single-echo T2* sensitivity is shown in red and blue (with TR and FA variations).

